Kalibrate Planning: hints and tips

The Kalibrate team will keep these Kalibrate Planning hints and tips updated monthly, so be sure to check in regularly using our Decision Maker newsletter. If you have any questions, please reach out to a member of our team.
October hints and tips: decrypting the Operations score
The Operations score is unique in that it is the only score that can be adjusted by the users. How can the user be sure to set it appropriately? The below article will give a brief overview of the Operations score and introduce the new tool in Kalibrate Planning to make choosing the right Operations score a breeze!
What is the Operations score?
The Operations Score is one of the 7 Elements identified by the KPL model to help identify the drivers of performance for each station in the model.
The other 6 Elements (Location, Market, Brand, Facilities, Merchandising and Price) are all driven by specific site characteristics captured as part of our survey process.
The Operations score differs in that it is used to identify the intangible elements that affect site performance, but cannot be explained by any of the tangible site characteristics surveyed. Typical examples of intangible factors are customer service, dealer cashflow issues, quality of maintenance.
How is the Operations score used in the Model?
Every surveyed site will have a calculated Operations score which represents the performance of the site which is not accounted for by the other tangible 6 Elements. But how can we set the appropriate Operations score for a new site or a site which we have altered?
When setting the Operations score for a new build it is important to understand how the model uses the score. Each site’s characteristics are compared to the other sites in the trade area to understand how attractive the site is compared to its competition and therefore the share of the available market the site can capture. To set the Operations score appropriately, it is important to understand the performance of the nearby sites and how you would benchmark the new site against those competitors.
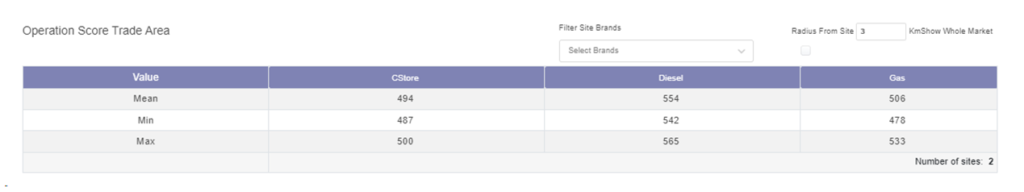
How can I choose the right Operations score?
To make this analysis simple, a new functionality has been added to Kalibrate Planning. On the new build or alter screen, it is now possible to see an overview of the Operations score within a user defined trade area. The user can also choose to only view the Operations score for certain brands, to allow the user how to better position the Operations score in line with other sites of the same brand or to use other similar brands as a benchmark.
If you have any questions about the Operations Score or the new functionality, please don’t hesitate to contact your Customer Success Manager.
Read more articles about:
Location intelligenceSubscribe and get the latest updates
You may unsubscribe from our mailing list at any time. To understand how and why we process your data, please see our Privacy & Cookies Policy
Related Resources
Uncategorized
On-demand demo of Kalibrate Market Intelligence
For fuel retailers that want to gain market share, KMI provides granular detail on competitor performance allowing...
Uncategorized
Kalibrate celebrates Easter
This year, Easter Sunday is on 9 April. This date varies from year to year. It is celebrated on the first Sunday...