Understanding the total picture in fuel network planning: A guide to market landscape and site performance

The shifting landscape
The fuel and convenience landscape has shifted considerably over the course of the last decade, and markets around the world have faced demand volatility regardless of their maturity. In especially unpredictable times, a renewed focus on future-proofing decision making is critical. Retailers need to ensure the decisions they make today are flexible and robust enough to keep up with evolving consumer expectations and business landscapes.
That means applying flexible, robust planning solutions — solutions that can easily and frequently be updated to reflect market changes, ingest new data types as they emerge, and provide a single source of truth across fuel and convenience offers. This holistic view of the network — across fuel, food on-the-go, groceries, and other services — is essential to dialing up and down an offer in tandem with a rapidly evolving market.
There are 7 Elements for Fuel and Convenience Retail Success, which retailers should consider in conjunction with market maturity, to properly plan their network strategy. These are location, market, brand, facilities, merchandising, price, and operations.
Assessing site performance across the 7 Elements is key — but how should your market landscape and level of maturity impact your network strategy?
How mature is your market?
Understanding your market’s stage in the maturity cycle is the first step in optimizing your network planning. As markets mature, elements for fuel and convenience retail success vary in importance.
Let’s examine the stages of market maturity and the impact they have on fuel pricing, as an example.
We start with a regulated market. The government controls price, so the other six elements — especially merchandising, facilities, and branding — become important as the areas where retailers deliver added value. Consumers don’t consider price, so retailers don’t have to either.
But in a newly deregulated market, price suddenly becomes critical. It remains important through the competitive market stage and into the volatile market stage, where prices might be changing three or four times a day. In some extreme volatile markets, we’ve seen prices changing up to 15 times a day. Remember in the long run, sites where all elements are strong will continue to thrive in the market.
As well as pricing, market maturity has a big impact on building — whether retailers should be building new sites, acquiring new sites, or optimizing existing investments. Initially, in heavily regulated and newly deregulated markets, retailers should focus on getting the best pieces of land in the best possible locations.
When markets begin to mature, network and site optimization become more important because there will be fewer new-to-industry (NTI) site opportunities. As the average volume in the market declines to below the country/industry average, new builds become almost non-existent. In these markets, retailers are looking to elicit every single dollar and every single liter that they possibly can from existing networks.
Ultimately, competition increases as a market matures, so establishing and then continuously optimizing a fuel and convenience retail network is crucial.
As markets become more mature, fuel network planning strategies become more sophisticated. Typically, there’s very little merger and acquisition activity in the early stages. This comes later in the maturity cycle.
The same is true of site rationalization. The earlier in the cycle, the more it’s about mass and quantity. Then, it’s about refinement: getting increasingly selective about sites and the impact they have on your brand.
Retailers may also need to reevaluate their network or tweak their planning strategy reactively, for example, if a competitor opens a site nearby. So, while you can plan and refine a strategy to the Nth degree, always be ready to be reactive and agile enough to change your approach, should the marketplace change.
Let’s take a deeper dive into those strategies, and how to maximize value through each.
New-to-industry — breaking ground
New-to-industry opportunities — or green-field opportunities — are locations where a fuel retail site has never existed before. Generally speaking, retailers look for locations to build new fuel or convenience store outlets in relatively immature markets or high growth/evolving areas of a market. A good example of this is in a newly deregulated region, as major brands from overseas attempt to enter the market.
S-curve analysis
The S-curve is really valuable if you aren’t sure of the best market for a new site. It’s a well-accepted theory, where the demand curve is segmented into three discrete areas.
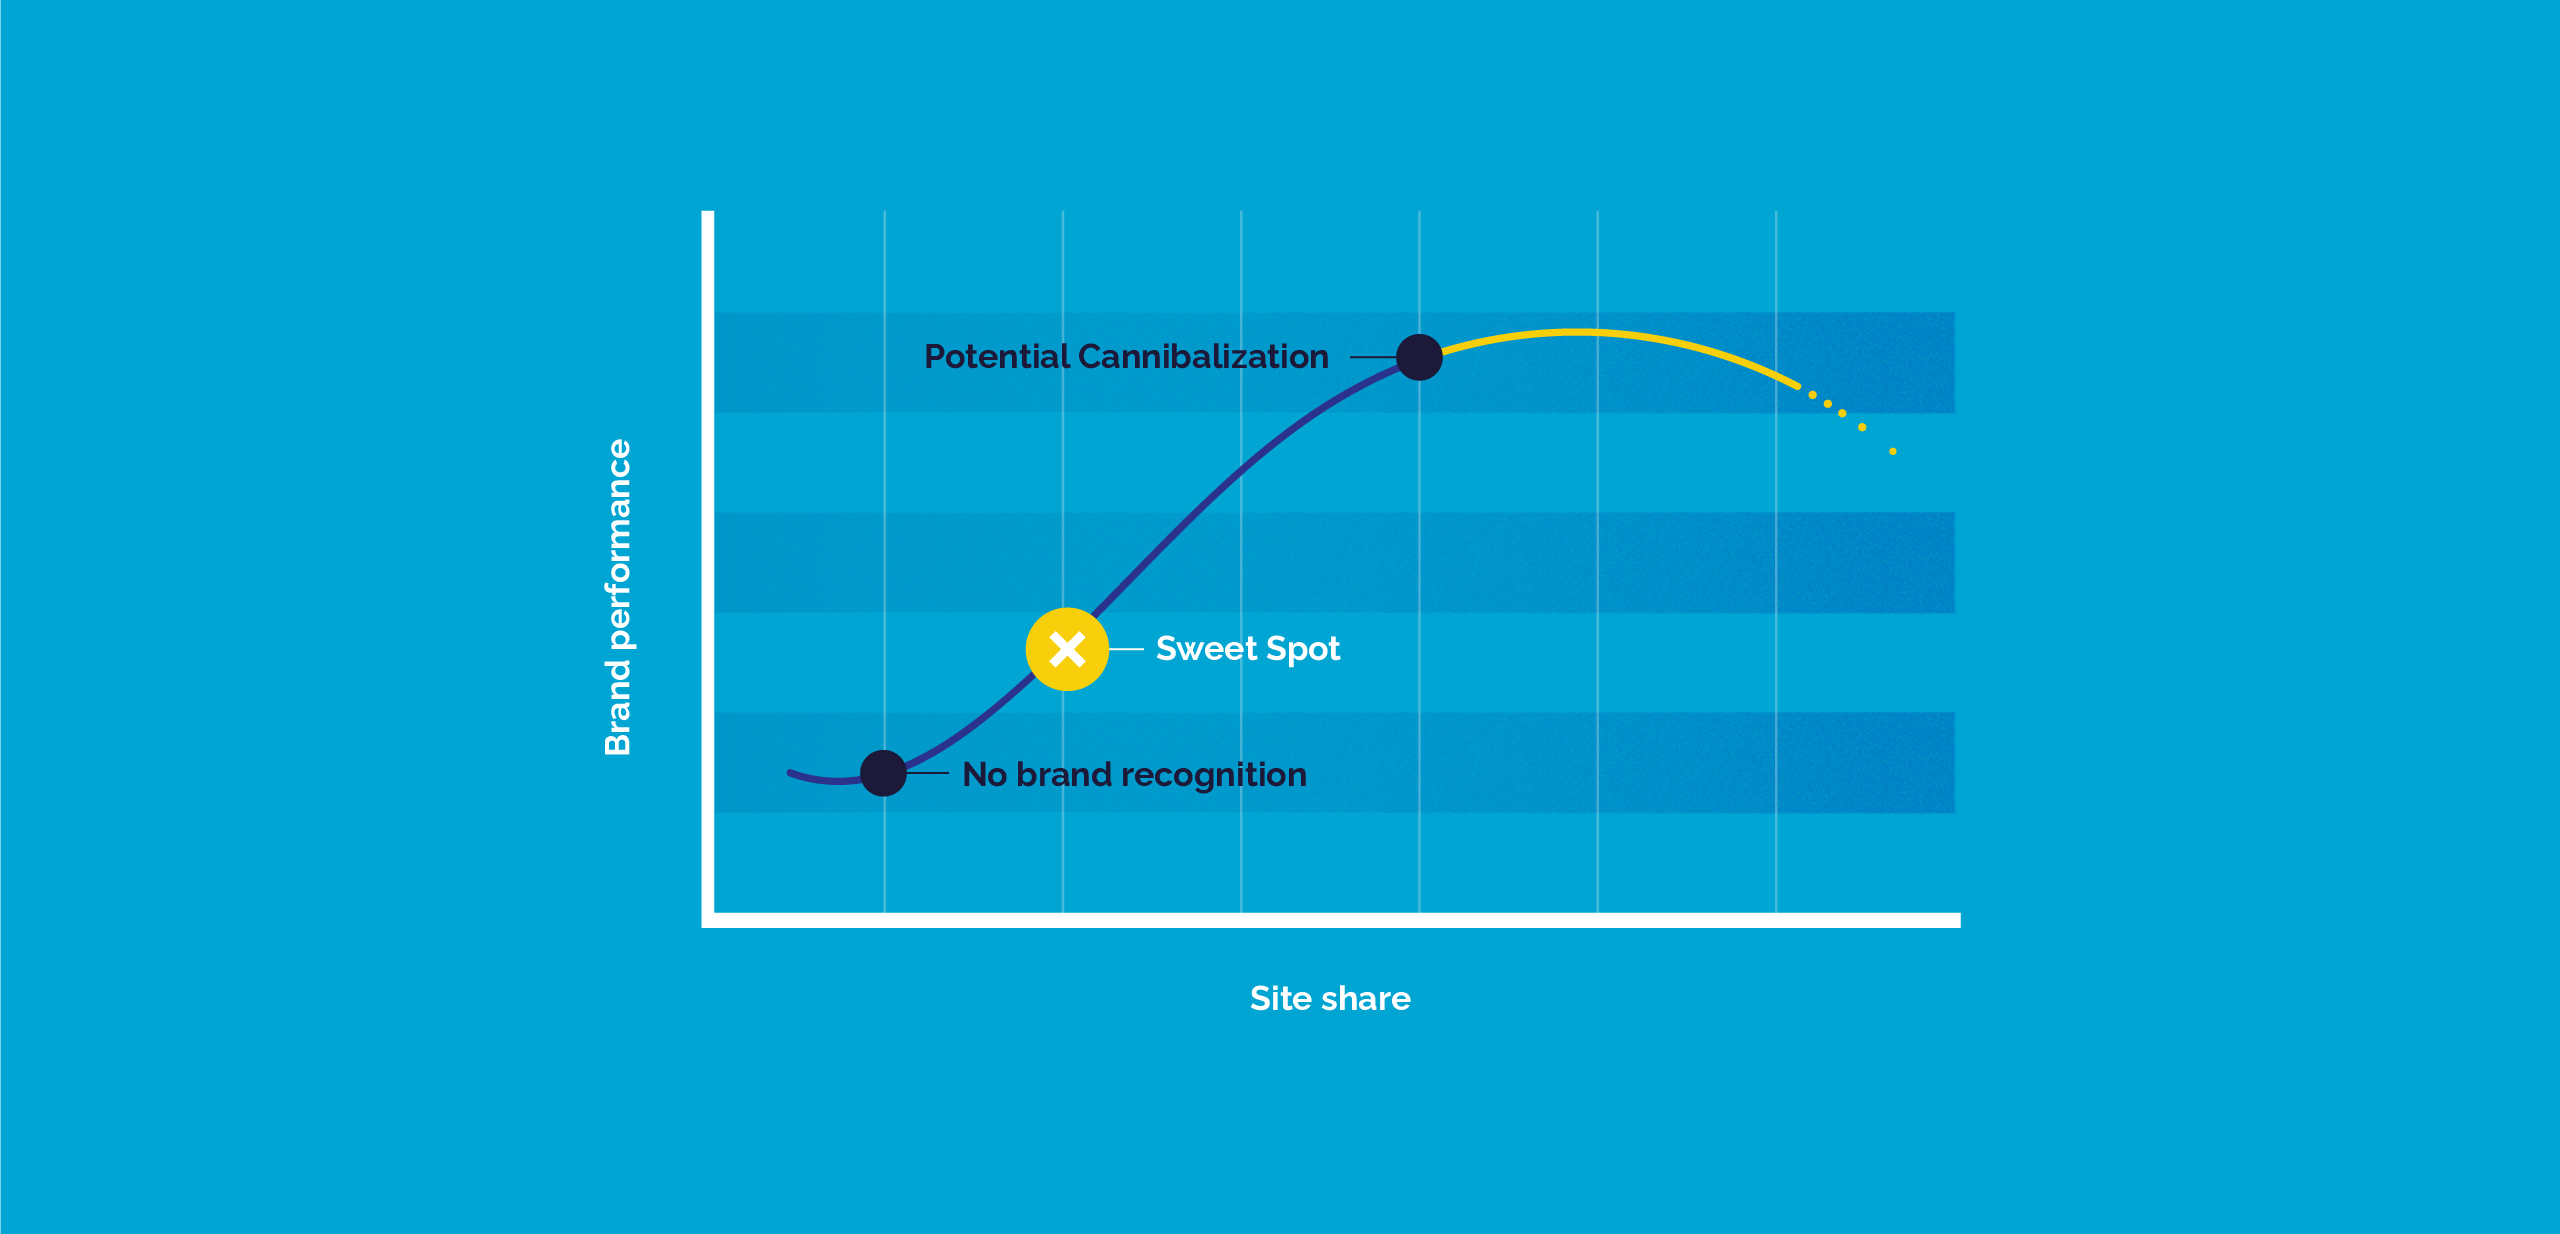
At the lower part of the curve, there’s no brand recognition. If the network of sites in question lies at the lower end of the curve, it means that customers in that marketplace don’t have a value associated with your brand.
If you’re in the higher end, towards the right of the curve, then you’ve actually started cannibalizing demand from your own sites. The middle of the S-curve is the sweet spot for potential growth.
If a retailer is approaching the first demarcation, or in the early stages of the sweet spot, there’s a great opportunity to increase brand recognition without risking cannibalization.
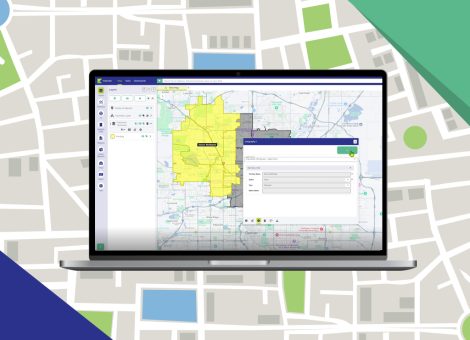
Once the right market has been identified, think about the location. A tool like Kalibrate Planning allows retailers to run simulations to assess locations within a city or market, to understand the value and volume that could be delivered from a specific location.
It’s possible to forecast volume based on the 7 Elements and predict how much can be achieved from a specific location. It’s also possible to run simulations that examine the impact any changes would have. For example, if a retailer improved facilities at a location, how would that impact volume?
In summary, examining new-to-industry sites requires a three step approach:
- Establish the right market for growth
- Look at candidate locations within that market
- Understand how to drive maximum volume from each of those locations
Taking the charge with network optimization
To optimize an existing network and derive maximum value from it, analysis in the form of a performance potential quadrant is critical. This quadrant analyzes every owned site within a network.
Performance potential quadrant (PPQ) analysis
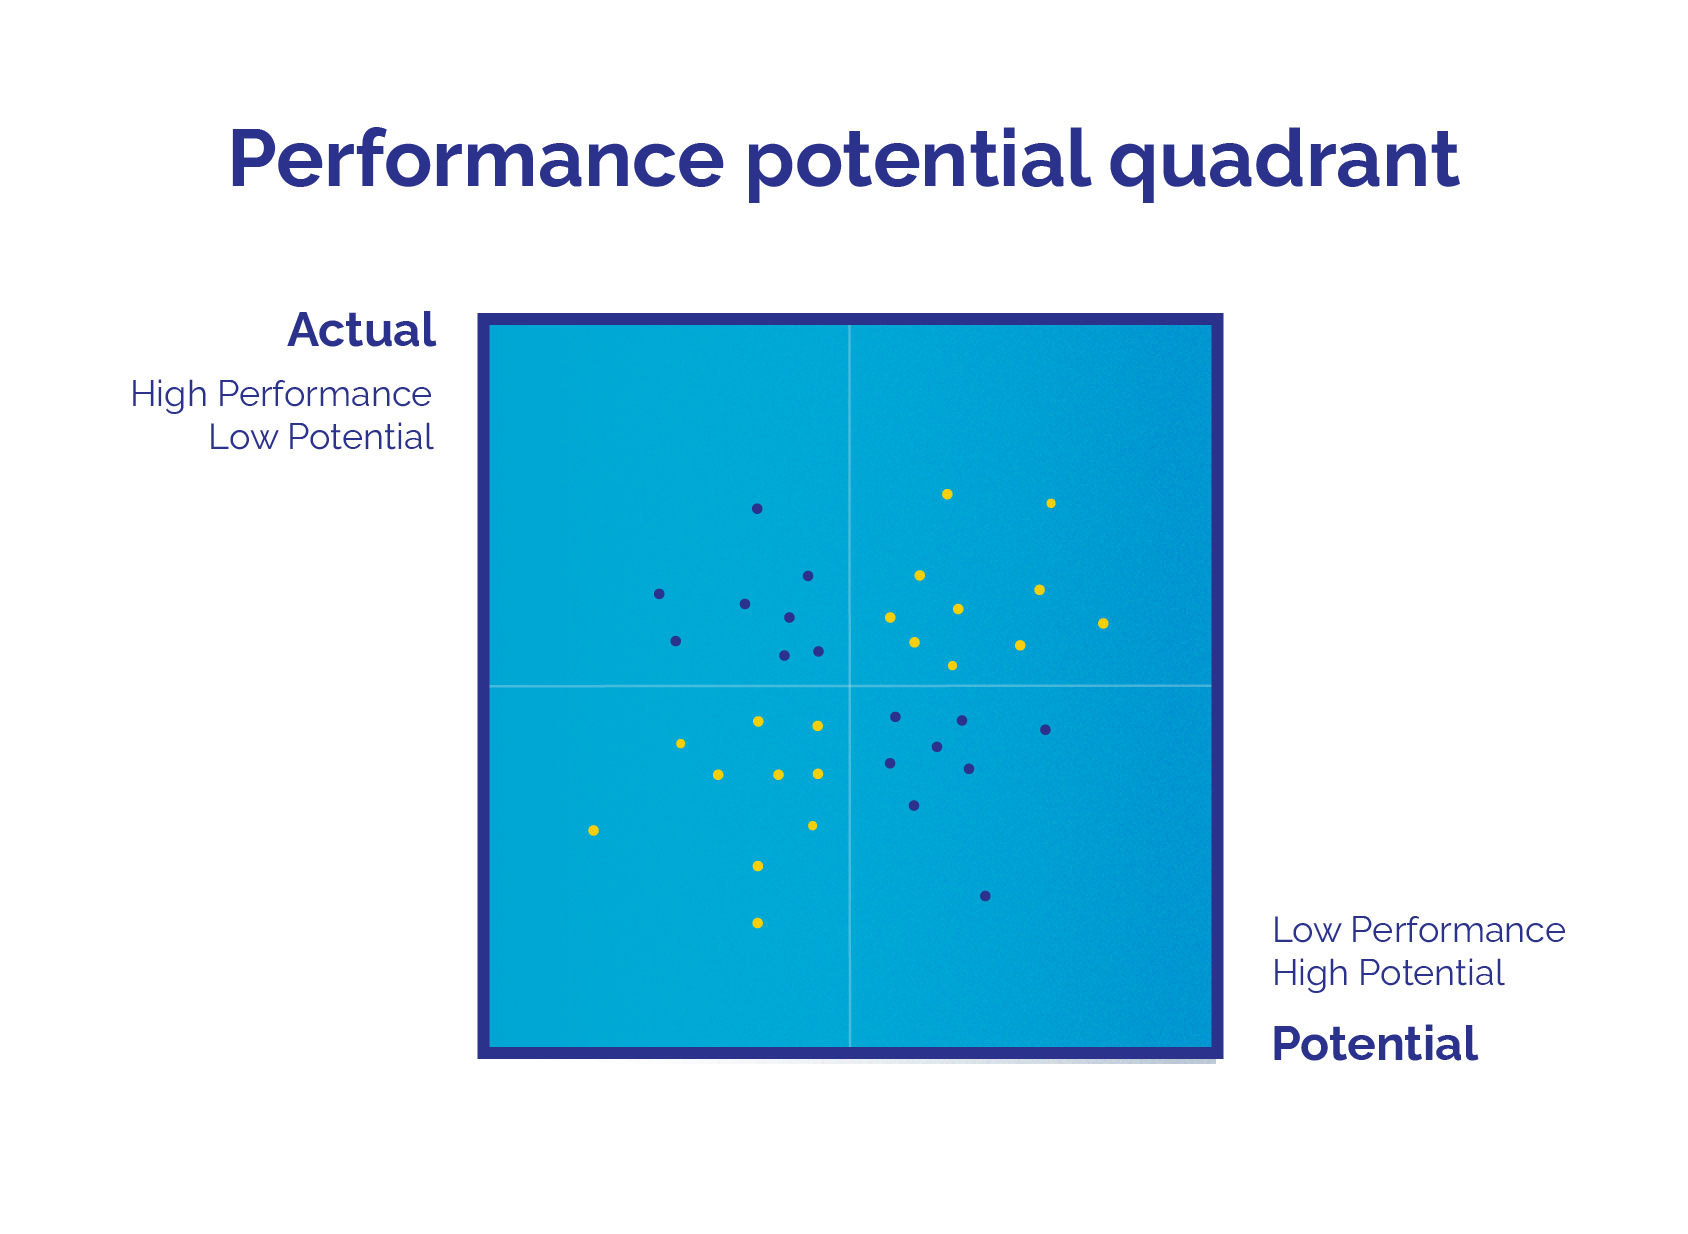
Plot every owned site on the quadrant, using the axes:
- X-axis: potential performance of each site within the market
- Y-axis: actual performance of each site within the market
Potential performance is often called “dirt strength”. It’s primarily driven by the location and market, and doesn’t change across retailer, brand, or type of offering. The “piece of dirt” is the same for everyone at that location.
It’s what you do with that piece of dirt — the brand, the number of pumps, opening hours, the way you price and operate, the facilities — that determines actual performance.
Every single site in a network should be plotted in a performance potential quadrant.
- Those in the top right quadrant are high potential and high actual. They’re meeting their expectations; they’re the stars of the network.
- Those in the bottom left quadrant have low potential and low actual performance. They’re candidates for debranding, divestment, or rationalization.
- Those in the top left quadrant are outperforming their dirt strength. Sites that are outperforming their potential require investigation, because they could very quickly slip down to their natural performance if a new variable, such as a new competitor, is introduced. Continue to monitor the sites in this quadrant.
- The most exciting quadrant in network optimization is the bottom right. These sites have high potential, which they aren’t meeting.
It’s important to analyze each of these sites against the 7 Elements, to understand which element is driving poor performance. Even just knowing which element is the issue is useful, but what’s exciting is having the ability to run simulations to quantify the impact of potential adjustments.
To surmise, there are two key steps in effective network optimization:
- Identify where there’s potential
- Run simulations to understand the impact of planned improvements
Are you utilizing your dirt strength? Try our quick, editable checklist to apply some key PPQ learnings and actions within your own network.
As markets mature, and network strategies become more sophisticated, the next step after optimizing the sites you already own is considering where else you can gain value.
M&A — the secret to mid-market maturity?
When considering mergers and acquisitions, retailers must examine how acquisition candidates are performing in the performance potential quadrant.
Consider a high performance competitor site that is up for acquisition. If a prospective buyer considered actual performance alone, it would look appealing. That’s why it’s important to understand potential, too.
If actual performance is good but potential low, a site is outperforming its dirt. It wouldn’t take much for performance to drop to what would reasonably be expected from its dirt strength. In that case, a retailer would have overpaid for a site that was never going to generate significant future value.
Conversely, there might be a network of sites in the bottom right quadrant (low performance, high potential) which could be acquired inexpensively.
By examining these sites, simulating their current performance across the 7 Elements, and assessing how they could be improved, retailers can gain a deep understanding of the potential of their investment.
Using performance potential quadrant analysis in acquisition strategy can help retailers avoid very costly mistakes, gain great network additions at lower cost, and accurately predict what to expect when making changes to the way the current vendor operates. Retailers can also determine how the potential acquisition network “fits in” or “fills in” their existing network, including cannibalizing volume from their own sites.
Rationalization — forgoing mass to build brand
Network rationalization again requires examination of the performance potential quadrant, to understand the potential volume — or dirt strength — of every site in a fuel network.
It requires assessment of the location and market, distinct from any of the other 7 Elements, to understand what a retailer can reasonably expect to achieve from that location.
As before, it’s then important to plot the actual performance of each site, incorporating the other five elements. This provides a comprehensive overview of network performance and highlights any sites that are ripe for rationalization. Sites that have low potential are typically candidates for divestment or simply closure. If the site is profitable to the retailer, although under-performing volumetrically, consider debranding the site to minimize the impact to the brand image.
Without this quadrant analysis, there is a risk that retailers could make some bad choices. For example, they may only examine sites in terms of actual volume or revenue being achieved. This might see them discount those with low performance, rather than those with low performance and low potential.
Kalibrate Planning helps retailers to understand the current performance of their networks, but also highlights sites which are genuine candidates for divestment or closure.
Going deeper — adding and visualizing data
New-to-industry builds, network optimization, mergers and acquisitions, and rationalization are all very proactive planning use cases. There is one more use case for network planning and it’s reactive. That’s when something happens that is out of the retailer’s control: for example, a competitor opens a strong new offering within their market.
In such situations, the task is to maintain volume. And to maintain volume without sacrificing margin, it’s necessary to grow volume in the marketplace itself.
A new competitor, especially a strong one, changes the dynamics completely within a market, so incumbent retailers will need to reassess their offering across all 7 Elements to make sure each site is working as hard as it can. This reassessment of their own offering should be carried out with an eye on competitor strengths and weaknesses too. For example, if the competition is weak in facilities, concentrate efforts there.
To truly understand your local market, you need a complete market data set to benchmark your strengths and weaknesses against your direct competition. Hear from Janet Tooke, Senior Client Services Manager — Planning, on how to effectively benchmark your own offer against the competition.
Kalibrate’s complete market set data allows for full benchmarking against competitors to unearth your strengths and weaknesses, run simulations, and conduct pacesetter analysis.
Simulating changes is key to confident, reliable decision making. How would increasing the number of pumps, changing opening hours, or introducing fresh food or a quick service restaurant, impact site performance? Exploration of options through simulation is typically what’s needed to ensure effective fuel network planning and extract maximum value from current and future sites.
Future-proofing decisions and creating the necessary reactivity in these uncertain times means relying on technology that can change tactics with your strategy, and the wider market.
What does that mean specifically? It means the data you use should be accurate and up-to-date, and the way you interact with it should be relentlessly efficient.
Interacting seamlessly: the importance of your software interface
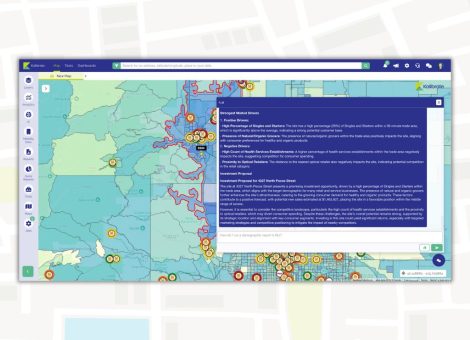
Having an interface that’s well recognized and familiar to users creates efficiencies on multiple fronts. For network planning purposes, a map view is the most visually effective and easily navigable way to display a wealth of complex information. Look for solutions that incorporate software you’re already familiar with. Kalibrate Planning uses Google Maps, offering the whole suite of Google functionality from satellite to Street View, so you can explore locations in whatever depth you choose.
You should also be able to access the interface from anywhere. The latest iteration of Kalibrate Planning is mobile-ready, so you can make quick decisions and implement them whether you’re in the office or not — a feature that’s become more important than ever when working practices are shifting so rapidly.
Integrating smoothly: ingesting new datasets
New datasets are emerging all the time. And as more data — and more data types — become available, it’s critical that retailers have a means of ingesting and analyzing it, to keep decision making at the cutting-edge.
Utilizing a map interface with geocoded data allows for new information to be easily added and seamlessly mapped to network and trade area assessments.
Hear from Rich Wilcox, VP Data Operations, on how best to leverage other data sources and integrate them with Kalibrate Planning.
To make proactive capital investments, and defend your corner against unpredictable outside influences, robust data sets and advanced predictive modeling are key weapons in your armoury.
Kalibrate Planning empowers you to maximize profitability across your fuel and retail network – from expansion and acquisition, to optimization and potential rationalization, no matter which stage of market maturity cycle you’re in.
We’ve recently launched Kalibrate Planning 3.0. The evolved platform has been developed in response to feedback from customers, and features an enhanced, maps-based UI, a library of linear and non-linear models, cutting-edge data science techniques, and a future-proofed approach to data. You can watch “An introduction to Kalibrate Planning 3.0”, or book a personalized demo with a Kalibrate expert.
Read more articles about:
Location intelligenceRelated Resources
Location intelligence
Right-size your franchise territories: Maximize revenue per market
Franchise territory management tools are evolving changing with advances in location intelligence.
Location intelligence
AI in location intelligence: See it in action
See videos and screen captures of how AI has been integrated into the KLI platform.