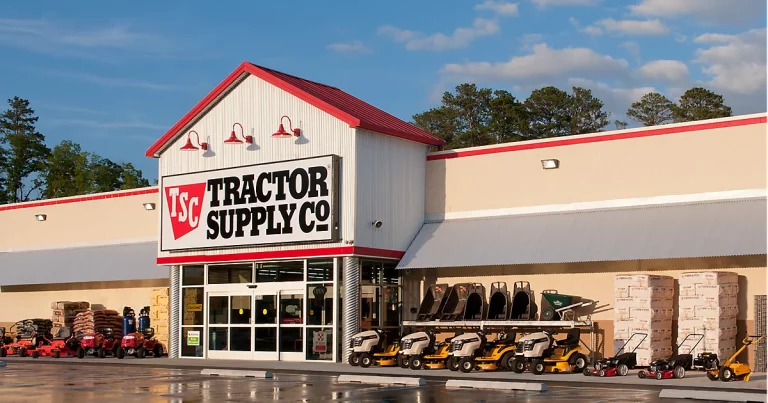
Location intelligence design to help retail operators grow with confidence.
The world’s finest location analytics and site selection solutions are on our menu.
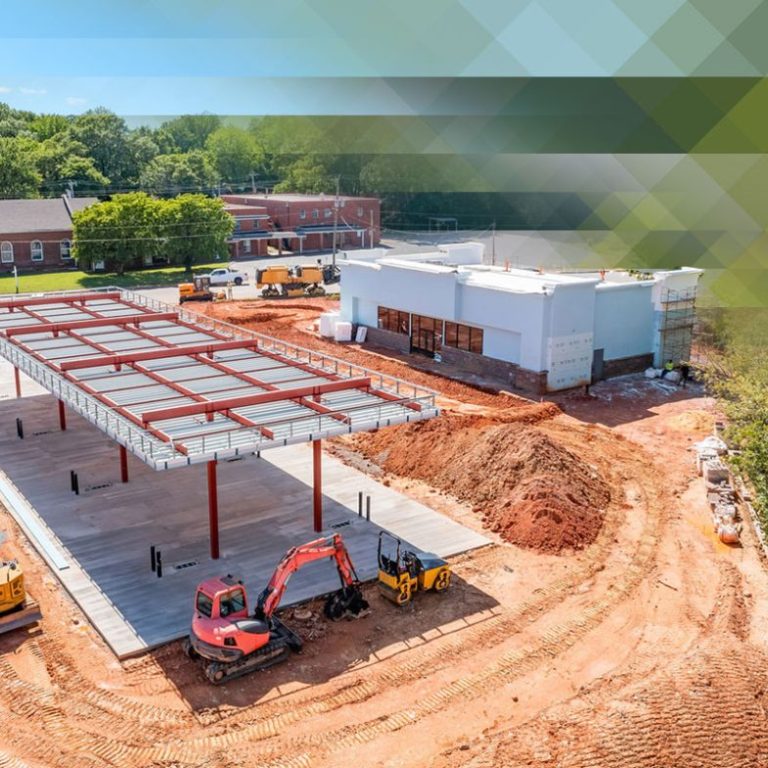
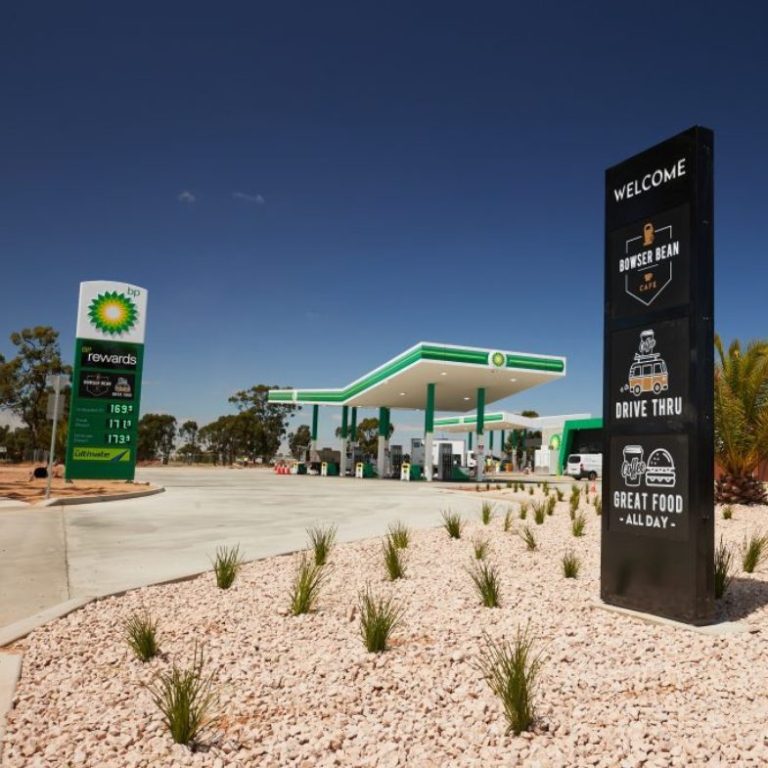
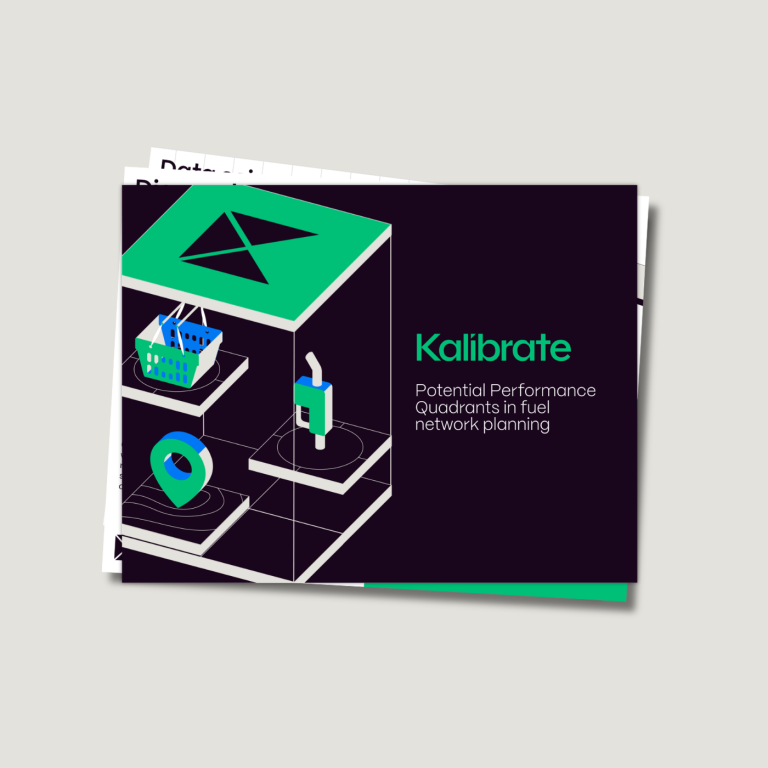
Fuel pricing, site evaluation, and network planning for all size of fuel retailers.
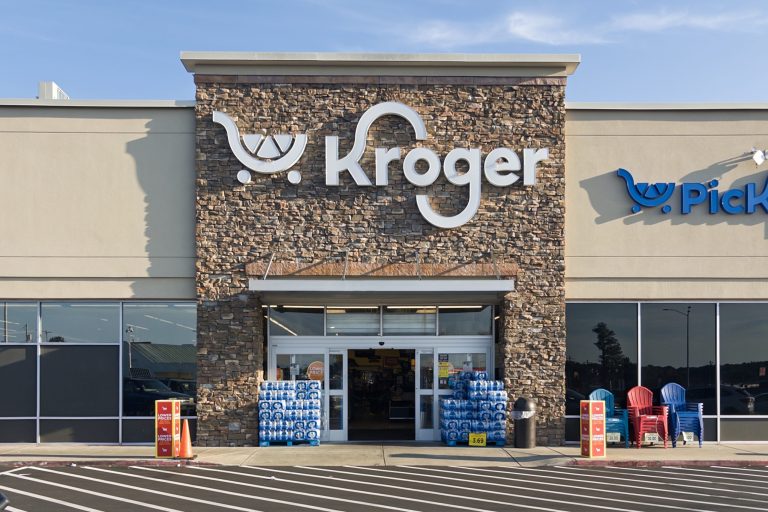
Fill your shopping cart with predictive analytics and site selection solutions, whatever your grocery concept.
Best of breed analytics and software are at your service.
Informing location-critical decisions across clinic growth and optimization.
Remove the guesswork to create an education center strategy with distinction.
Deep insights to inform real estate decision-making in banks, credit unions, and other financial operators.
Meaningful insights both to inform due diligence, investment theses, and portfolio growth.
Strategically manage your franchise territories and open high quality locations faster.
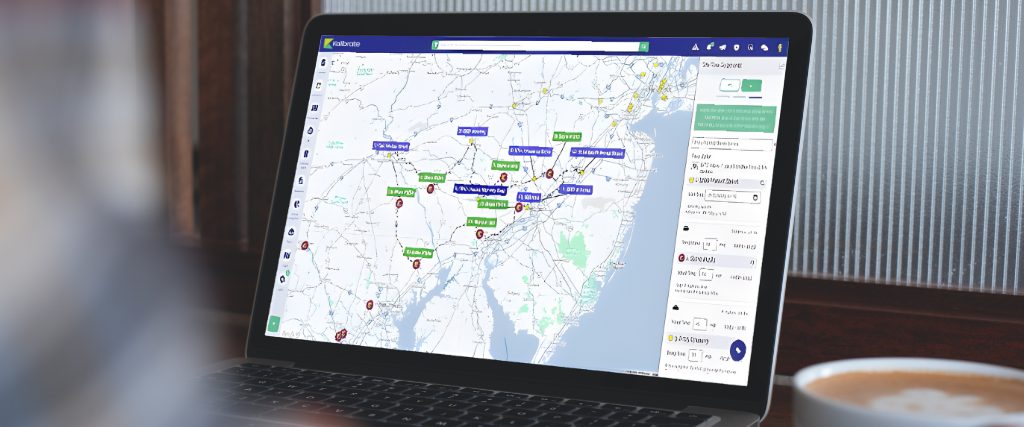
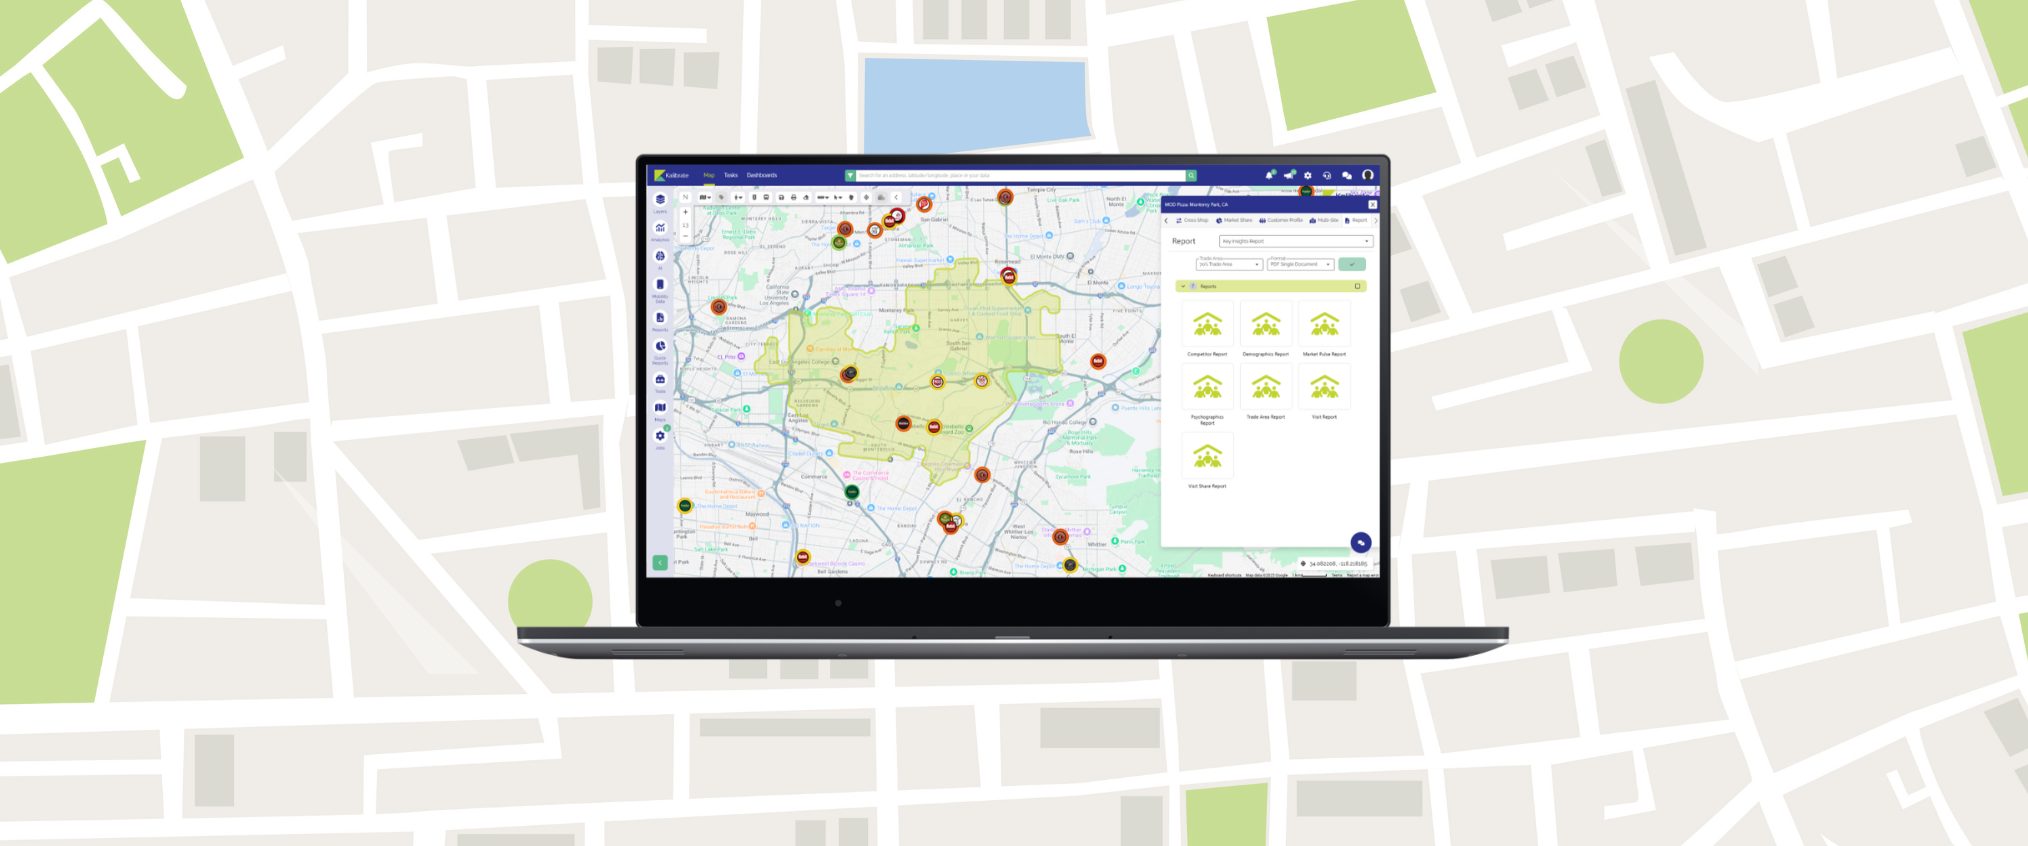
The gold standard platform for centralized location decisions and powerful analytics.
Flexible software that achieves your volume and margin targets.
Complete visibility over your fuel and convenience retail network.
Intelligent EV pricing solutions that scale with your charger network.
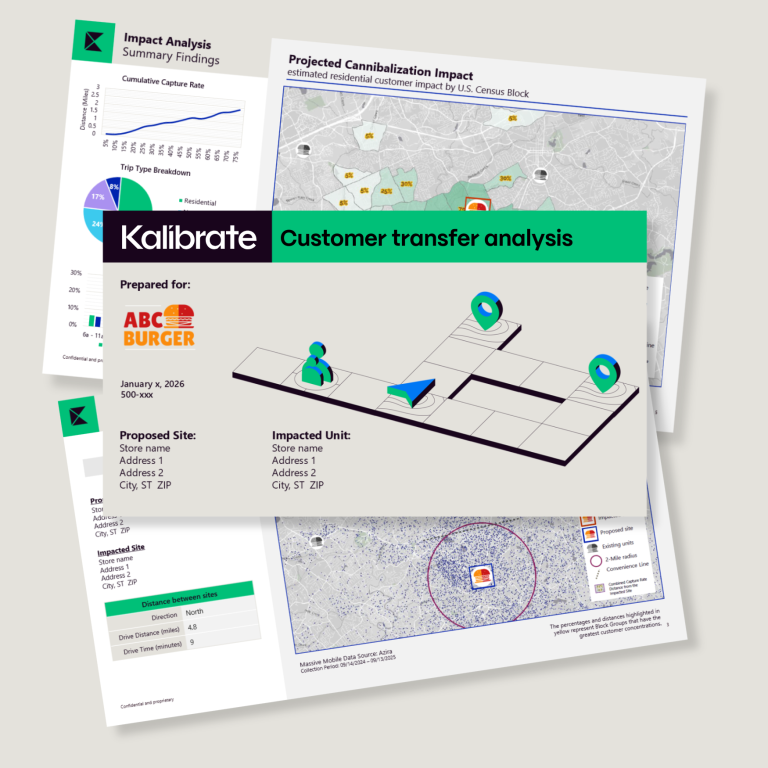
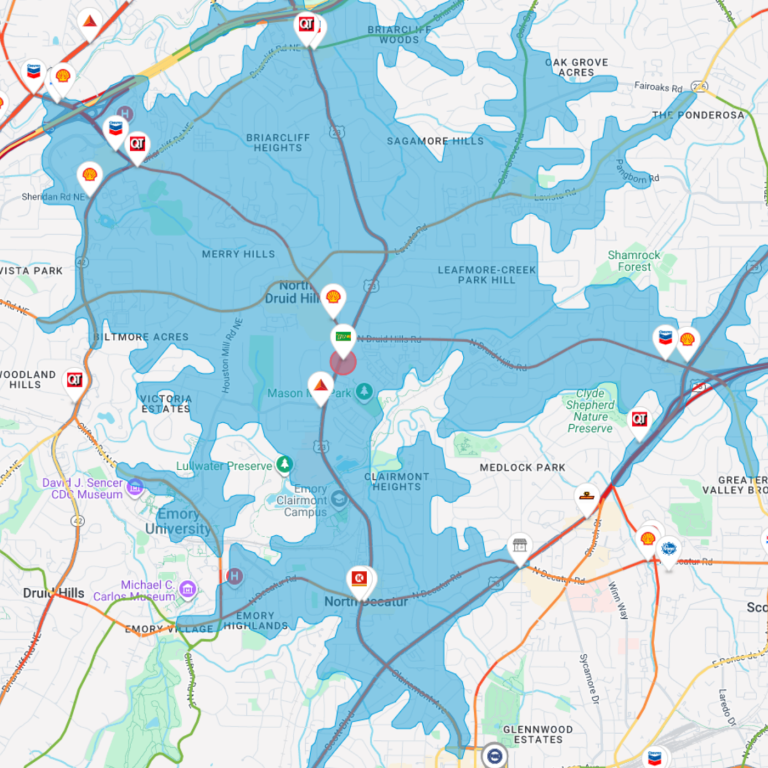
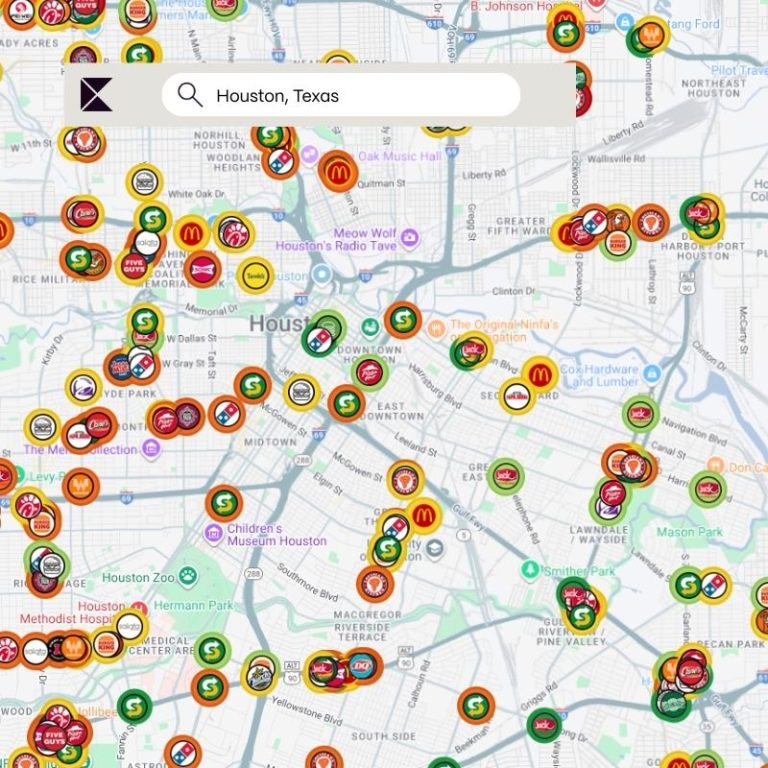
Foot traffic data to reveal deep insights into your sites, your customers, and your competition.
Advanced data science reveals what really drives a successful location.
Identify the total unit potential and optimal placement of locations.
On-demand insight to immediately forecast sales potential.
Respond to the growth of EVs with charger placement and pricing strategy.
Robust fuel and c-store volume projections for fuel site operators.
Explore our upcoming events, client stories, best practices and news from the industries we serve.
Unleash the power of data with Kalibrate's range of software. Act ahead of your competition and lead your market.
With 50+ years' experience building predictive analytical models, Kalibrate's solutions are the gold standard.