Understand ever-changing market conditions with mobility data: part two
In part one, we looked at the initial impact of the COVID-19 outbreak and the short-term impact on fuel and convenience retail in Georgia and South Carolina. Our case study focused on the coastal region around Savannah and Charleston.
In the two months that have followed, hundreds of millions of new data points have provided insight into how markets are recovering, what the “new normal” looks like, and how retailers can adapt, survive, and even thrive as a result of changing market dynamics.
We’ve seen COVID-19 wreaking havoc; changing life as we know it, and with it, redefining people’s movement patterns and purchasing decisions. Some markets, hopeful that there won’t be a second wave, are starting to see a return to something that resembles pre-COVID activity. While high-level statistics and anecdotal evidence may suggest signs of normality, mobility data shows sizable signals that a new era of consumer behavior is approaching. This should make even the most experienced retailers question their gut feel and investment decisions.
How are retailers recovering?
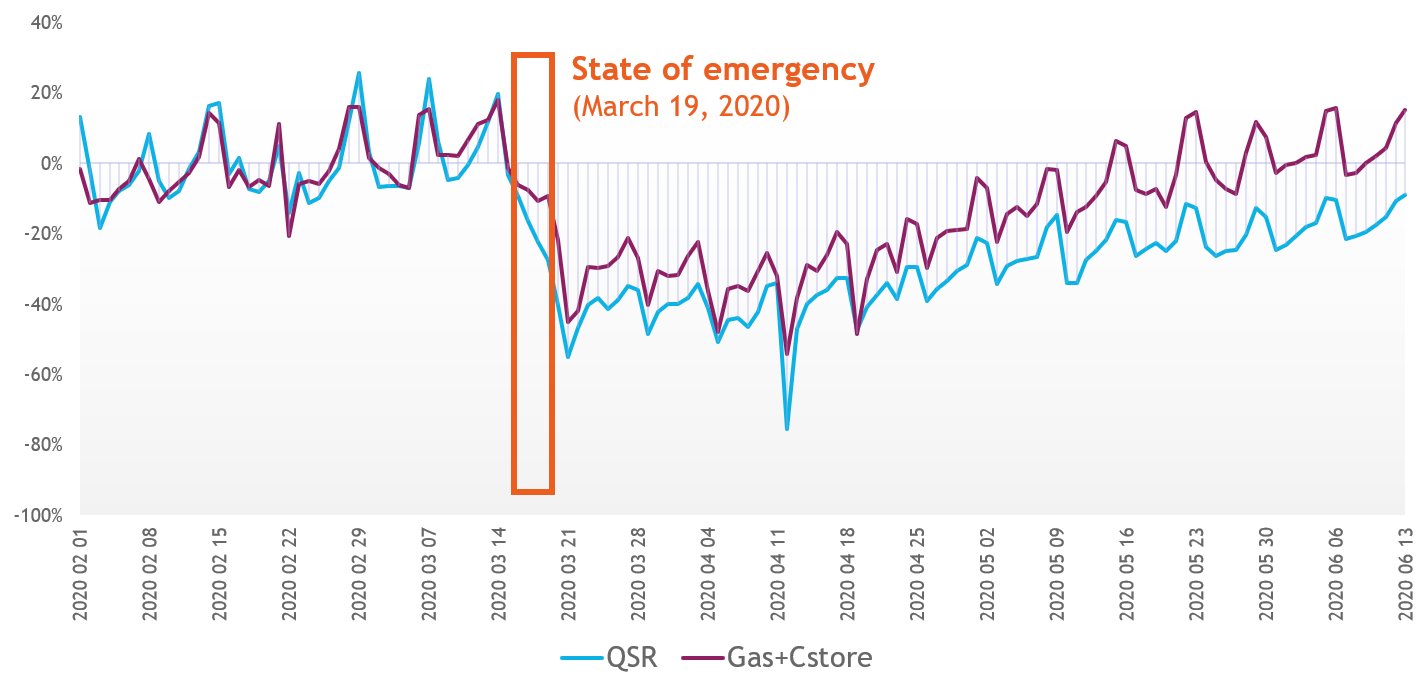
Back in May, we saw the footfall decrease by as much as 70% at stand-alone quick service restaurants (QSRs) and 60% at gas stations and convenience stores, shortly following a state of emergency announcement. Gas stations — considered an essential service for many — started to recover while the number of people visiting QSRs remained low. Since then, in the US at least, fuel and convenience retail has recovered faster than most people expected and is now only around 4% down on pre-COVID levels. However, despite dine-in restrictions gradually being lifted, food service recovery is slow. Footfall is still around 17% lower than before the outbreak, as shown by this graph:
Are trade areas shifting as a result of changing consumer behavior?
As the data above shows, the number of visits to gas stations and c-stores is recovering. However, consumers are making a conscious effort to contain the virus. They are working from home, reducing non-essential travel, and avoiding busy areas.
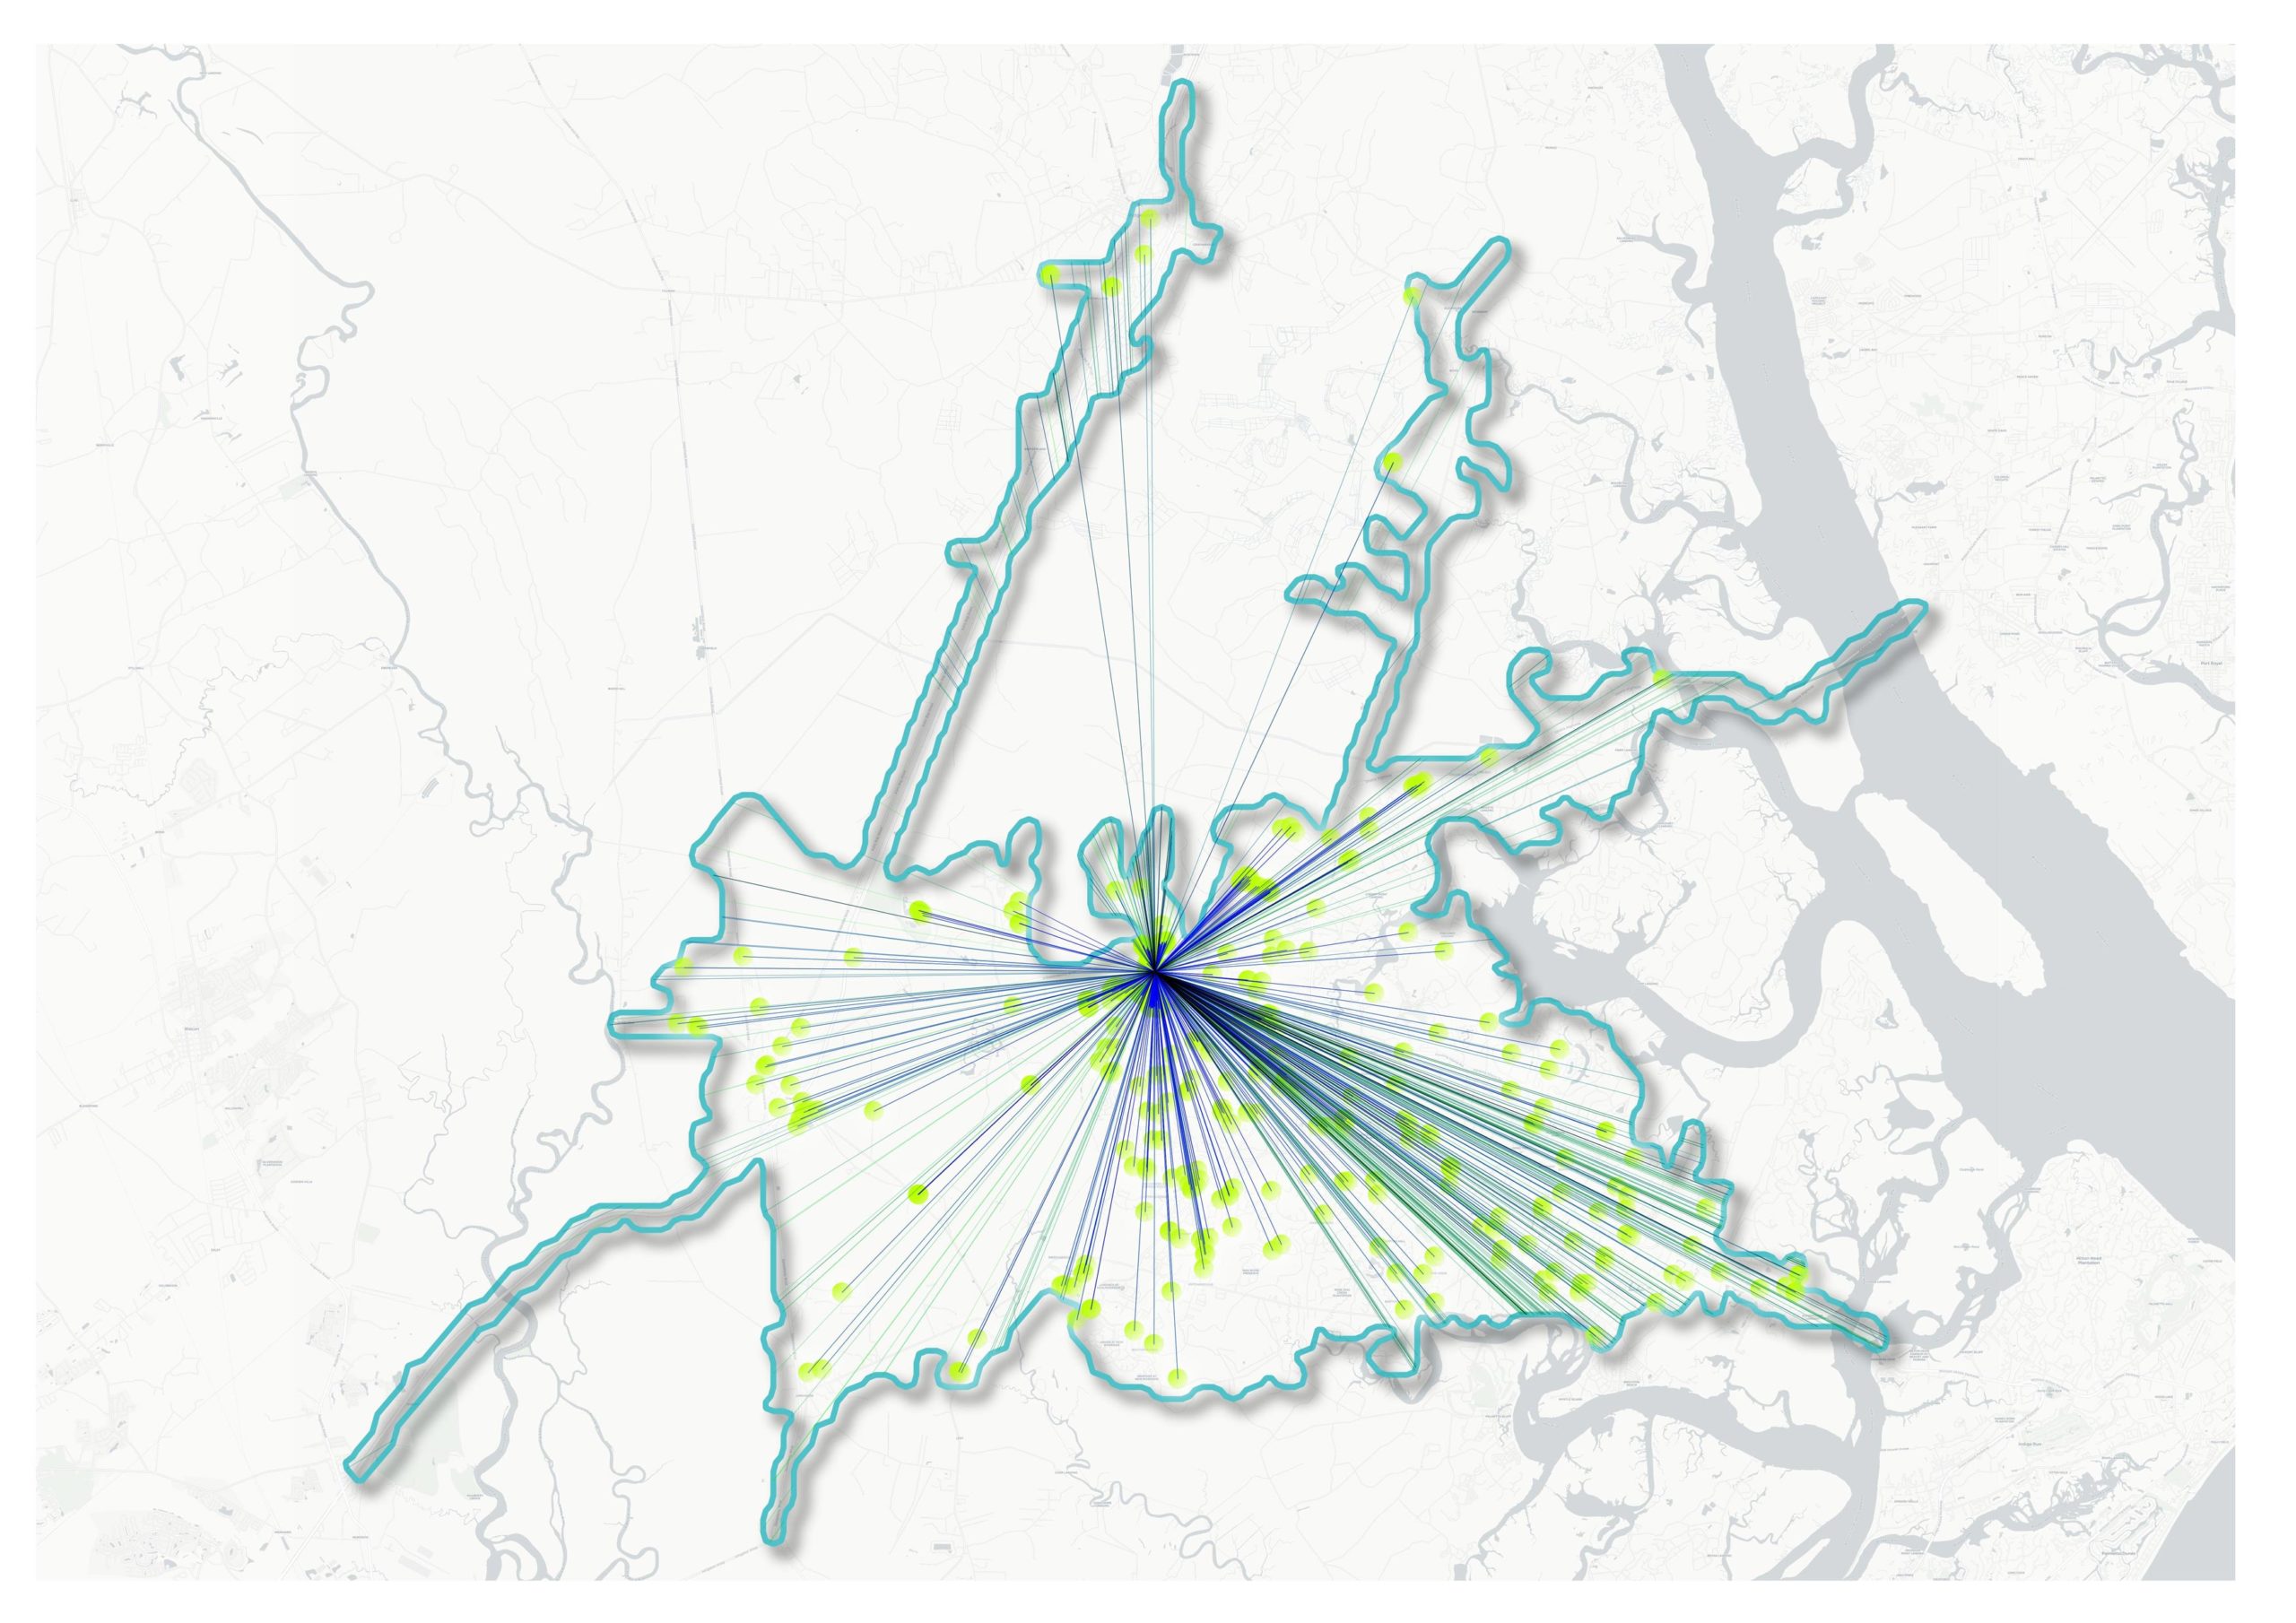
We have defined two-minute, five-minute, and 20-minute drive-time catchments around sites across a sample market. Origin-destination insights (the anonymized home location of visitors) provides us insights into where people are typically traveling from to visit a given location. The image below depicts all of the origin visits to one site over the study period.
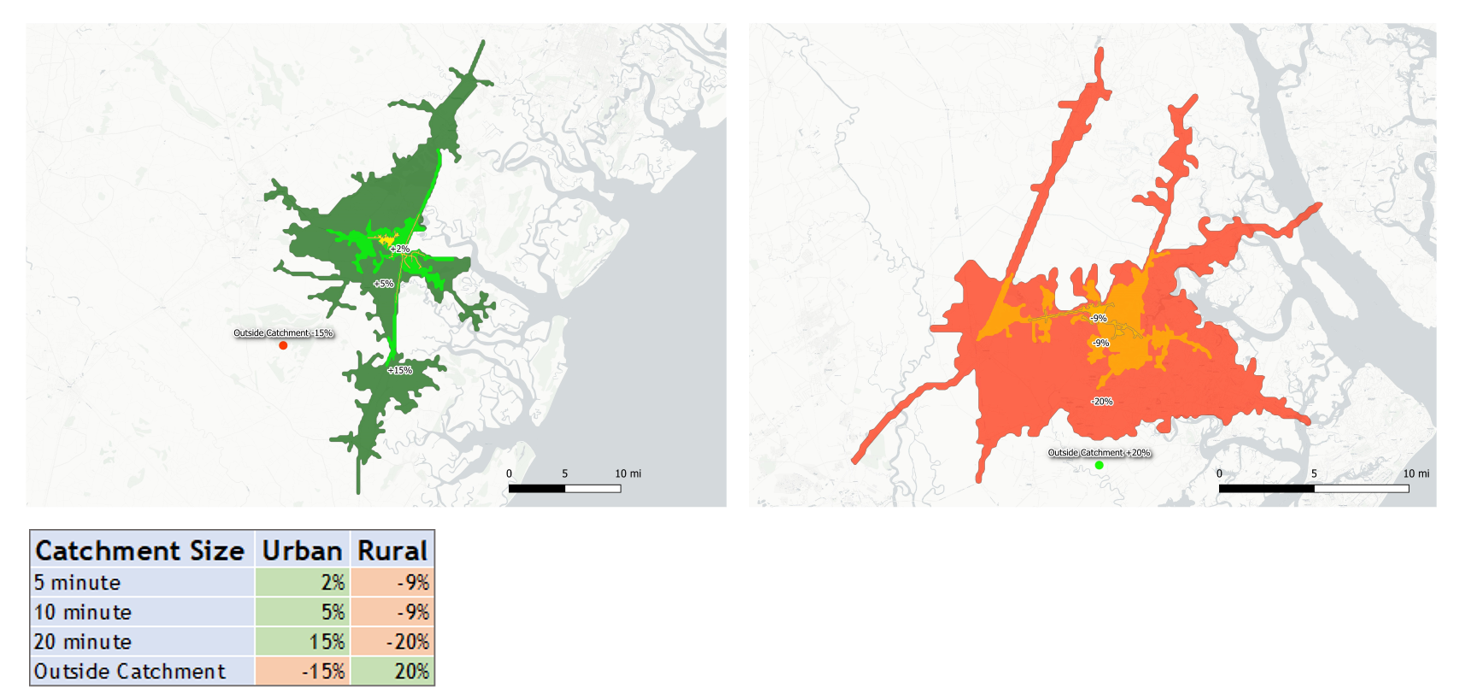
When analyzing sites’ trade areas before and after the COVID-19 peak, we see that in urban areas (below, green), fewer people are traveling in from further afield and the overall trade area is contracting; visits from outside of a 20-minute drive-time are down 15% in this example. For rural sites (below, red), the opposite can be seen; more people are visiting from outside of a 20-minute catchment.
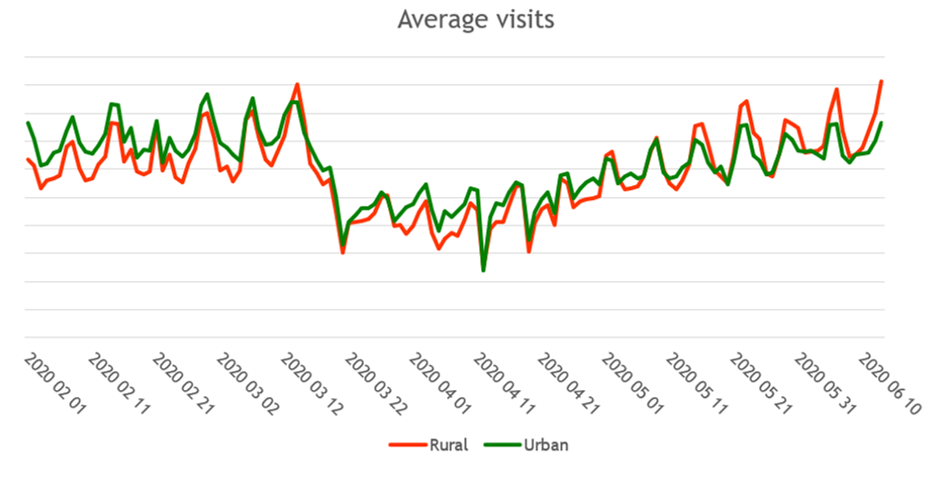
Are rural sites recovering faster than urban sites?
We can see that prior to the COVID-19 outbreak, urban sites consistently outperformed rural sites. During the recovery, we see the opposite trend, particularly on Fridays and Saturdays when footfall is at its highest.
What trends can be seen at a brand and facility level?
During the peak of the outbreak, we noted that consumers were putting aside their brand loyalty. Many of the larger, more established brands saw the biggest percentage decrease in footfall. While the overall market volume was down considerably, smaller players and unbranded sites were, in some cases, seeing a larger share of the available market. Brand loyalty is slowly returning, and market shares are close to where they were at the start of the year. However, some of the smaller local brands are holding on to an increased market share. Perhaps they have won over a new set of customers that otherwise would not have visited their sites?
Many QSR brands are still suffering significantly. However, some brands that offer a drive-through first approach have increased their market share by as much as 3% based on the current visitor numbers. As many consumers continue to socially distance, the drive-through is an obvious choice for those looking to minimize contact with others.
Are all markets recovering in the same way?
To put it simply, no. Nation-wide data for the USA, Canada, UK, and Australia clearly shows that the rate at which the USA is returning to pre-COVID numbers is surpassing any other country. Many other global markets are still down significantly and, based on current trends, the road to recovery will certainly be longer. In the third and final part of this blog, we will explore the global impact and how that compares.
How can we use this data to make better decisions?
The events of the past few months will result in financial challenges for all fuel, convenience, and QSR retailers. Future capital and operational investments will be scrutinized, and existing plans will be questioned. With the risk of a second wave, retailers will need to radically rethink how they approach and justify network planning decisions. The word “unprecedented” is, quite rightly, being used more than ever before. The gut feel and past experience that many rely on will — and should — be questioned. More than ever, retailers need data to understand their current market positions, strengths, and weaknesses. Data science and what-if analysis can allow retailers to understand a location’s true potential and play-out different scenarios. This ensures that all possibilities are considered, and that —regardless of how long a true recovery takes — they are set-up to adapt, survive, and thrive.
Speak to Kalibrate about how we’re leveraging this type of data within our core planning solution.
Co-authors
Brendon Edwards — GIS Research Analyst
Rich Wilcox — VP Data Operations
Read more articles about:
UncategorizedSubscribe and get the latest updates
You may unsubscribe from our mailing list at any time. To understand how and why we process your data, please see our Privacy & Cookies Policy
Related posts
Location intelligence
Understand ever-changing market conditions with mobility data: part one
The fuel and convenience retail landscape has changed beyond recognition. In these unprecedented times, retailers are...
Uncategorized
Understand ever-changing market conditions with mobility data: part three
Part three of our mobility blog series is available as a video, initially presented as part of Kalibrate's Fuel and...