The South African retail fuel market
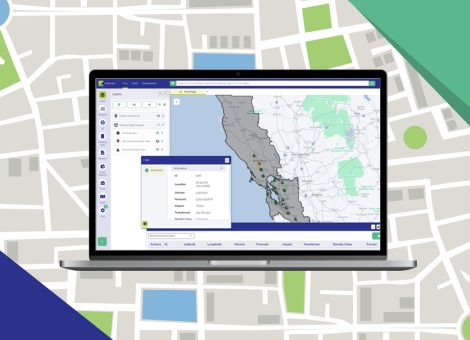
At Kalibrate we pride ourselves in truly getting to know our customers’ markets, so we can provide them the depth of insight they need to make the right decisions around their location strategy. Removing the guesswork from the fuel network planning is just one way we help fuel retailers maximize the value of capital investment.
In this piece, we examine the fuel market in South Africa through an examination of six key markets.
Of the approximately 11.1bn litres of petrol consumed in South Africa in 2020, we’ve surveyed and modelled service stations covering approximately 87% of this volume. Kalibrate assists clients with benchmarking and market ranking, to help them understand the scale of the opportunity and their competitive situation.
Let’s take a closer look at the landscape in South Arica, to see if we can identify which markets have potential for fuel retailers looking to grow or optimize their position.
Overview
According to SAPIA (South African Petroleum Industry Association), there are approximately 4600 service stations in South Africa.
South Africa consumes approximately 30bn litres of fuel per year, with Gauteng, Kwa-Zulu Natal and Cape Town consuming 20bn litres (67%) of this. South Africa has the second largest Oil Refining capacity in Africa. In 2018 it was producing 520 000 barrels a day. There are 6 refineries and 3800 km pipeline.
Economic growth in South Africa is expected to result in a fuel CAGR of 1.1% between 2020 – 2025. Factors influencing this are strong economic growth, increasing number of vehicle sales, and increasing population are expected to drive demand. ( https://www.mordorintelligence.com/industry-reports/south-africa-refined-petroleum-products-market#:~:text=South%20Africa’s%20refined%20petroleum%20products,demand%20for%20refined%20petroleum%20products.
Kalibrate has been surveying and modelling Gauteng, Cape Town, Durban/KZN and Eastern Cape for our South African clients for more than 20 years. More recently we have started surveying and modelling Limpopo and Mpumalanga as retailers have identified the attractiveness of these markets as regions for future investment opportunities.
Gauteng
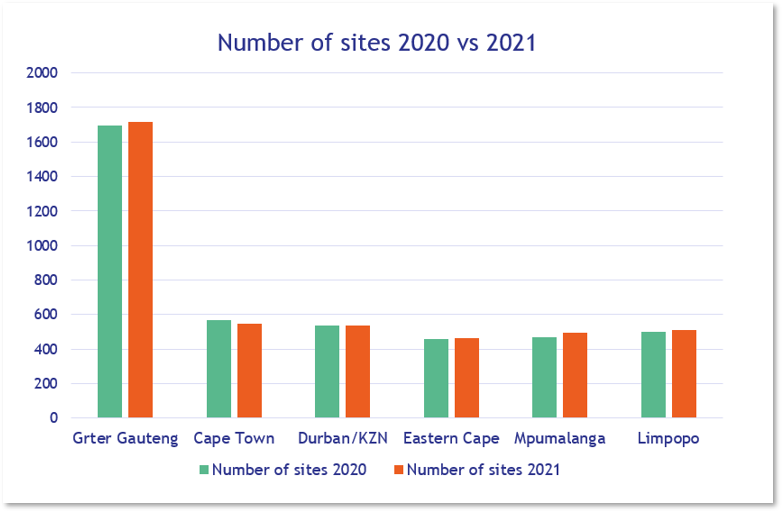
Gauteng is South Africa’s economic hub and largest market by far. It accounts for close to 40% of the country’s retail fuel demand with over 1,700 service stations.
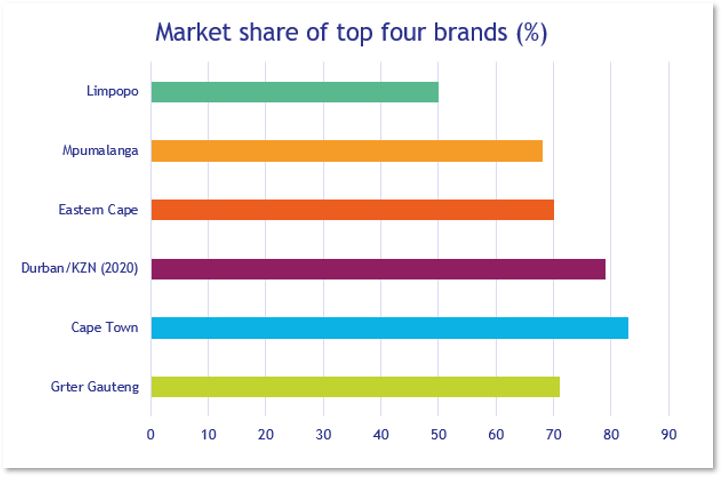
With the highest GDP per capita and growth rate of all the provinces, this is the most attractive market in terms of demand and potential growth. It has the highest volume throughput per site at an average combined fuel volume of 320 kl/mth in 2021. Number of service stations has grown since 2020 by an additional 20 new sites and a further 56 service stations are currently under construction. The four top brands in the market hold 71% of market share.
Sasol, a South African-owned company, is in the top four along with three multi-national oil companies. Sasol has strategically concentrated its’ Retail Fuel investment predominantly in Gauteng due its supply advantage in this region. Sasol continues to grow with 11.7% site share in 2020 to 12.1% site share in 2021, moving Sasol to number two market share behind Engen, who dominate the Gauteng market.
There are 19 brands in the market, more than in any other market in South Africa, indicating a growth in independent oil companies in this attractive and growing market This is a highly competitive market where investment requires understanding where the hot spots are. Identifying the best locations to invest will be the key to success.
Cape Town
Cape Town is the second highest contributor to GDP in South Africa with the second highest GDP per capita. An attractive market with second highest petrol demand behind Gauteng. Cape Town’s petrol demand has grown year on year from 2019 to 2021 (at 2%) above the national average. Average combined fuel of 297 kl/mth per site is the third most attractive throughput in the 6 markets surveyed and falls just behind Durban/KZN.
The market is dominated by four international oil companies who have a combined market share of 83%. There are fewer brands in the market than in Gauteng. Land opportunities are scarce and competition for land is high. Acquisition of existing sites or rebuild of existing sites may be a more effective way to grow in this market. By analysing Kalibrate’s Performance Potential Quadrant Analysis (PPQ) charts, it is evident that there are high potential opportunities for acquisition of existing sites amongst unbranded and independent sites. By using Kalibrate’s model these sites can be identified and their potential volumes (over and above their actual volumes) can be established. Sites under construction in this market have dropped off from 15 in 2019 to 8 in 2021 indicating a slow down of development in new builds for a number of reasons including scarcity of land and lengthy local authority approval processes.
Cape Town has traditionally been the market in which new shop concepts are piloted for the global market by International Oil companies. This has led to a world-class shop offer in many of the service stations. This has resulted in shop revenue per site being the highest in Cape Town of all 6 South African markets.
An attractive market, but with high barriers to entry make this a good opportunity for acquisition of existing service stations for new entrants, or for rebuild and consolidation of existing networks for existing brands.
Durban/KZN
The surveyed geography includes Durban, Pietermaritzburg, and the coastal strip from Richards Bay in the north to Port Edward in the south.
KZN has the second largest GDP in South Africa but ranks third in terms of GDP per capita behind Gauteng and Cape Town. Economic growth lags behind Gauteng and Cape Town but is still slightly positive. Civil unrest in the past few months have made this market less attractive to potential investors but it is likely to recover in the longer term.
Durban is home to two of the country’s largest oil refineries and is a major port for importation of crude and refined fuels. There are major fuel pipelines connecting Durban refineries to the Gauteng market.
Durban/KZN has 537 Retail service stations. The network is similar in size to Cape Town with higher average fuel throughput per site, driven by higher diesel volumes than Cape Town. Shop turnover per site is attractive and is ranked second behind Cape Town, ahead of Gauteng. The top 4 brands in this market have a combined market share of 79%. There are more independent brands in the Durban/KZN than in Gauteng and Cape Town indicating opportunities for acquisition and new investors.
Eastern Cape
The Eastern Cape is suffering from high unemployment and subsequently, the lowest GDP per capita of all provinces in South Africa. However, there are many areas along the Eastern Cape coastline that are very attractive tourist destinations resulting in pockets of attractive growth and opportunity.
With the Covid pandemic and resultant move to working from home, we are seeing a trend of more city dwellers moving to the attractive coastal towns in the Eastern Cape as they are no longer confined to the cities for work. This is creating a mini-boom in property and population growth in these attractive coastal towns.
Kalibrate’s Eastern Cape market study area stretches along the coast from Port Edward in the North to Mossel Bay in the south and incorporates the inland town of Queenstown. Key growth areas along the coast in this market include the holiday towns of Mossel Bay, Knysna, Plettenberg Bay, Cape St Francis, Kenton on Sea and Port Alfred.
With average fuel throughput per site at 247kl/mth, service stations are still making attractive returns, especially if locations are selected in the growth areas. An analysis of the pockets of growth in the market through Kalibrate’s micro-market studies will reveal the best investment opportunities for new service stations and for refurbishment of existing sites. There are currently 465 service stations in this market and the top 4 brands account for 70% of market share. As with Gauteng, Durban and Cape Town, Engen is highly invested in this market with the dominant market share. At the time of survey, there were 8 sites under construction in 2021 compared to 5 in 2020.
The key to success in this market will be finding the high potential pockets to take advantage of the expected growth in these areas.
Mpumalanga
Mpumalanga has the fourth highest GDP per capita despite being the second smallest geographic region behind Gauteng. It benefits from its proximity to Gauteng and advantageous fuel supply routes through the Maputo Development Corridor. Mpumalanga has been severely affected by the Covid pandemic and the resultant slow-down of the economy. Mpumalanga has experienced a contraction of economic growth in recent years.
Kalibrate has surveyed all Retail service stations in Mpumalanga. Petrol sales in Mpumalanga are very similar in quantity to the sales in the surveyed regions of the Eastern Cape as well as Limpopo. Mpumalanga average fuel throughput per site at 247 Kl/mth matches the Eastern Cape market. There are 497 service stations across Mpumalanga vs Eastern Cape’s 465 sites. Diesel volumes are stronger in this market vs Eastern Cape, possibly driven by heavier transient traffic. Unlike the other key markets in South Africa where Engen dominates, Total South Africa are the market share leaders in Mpumalanga and Limpopo.
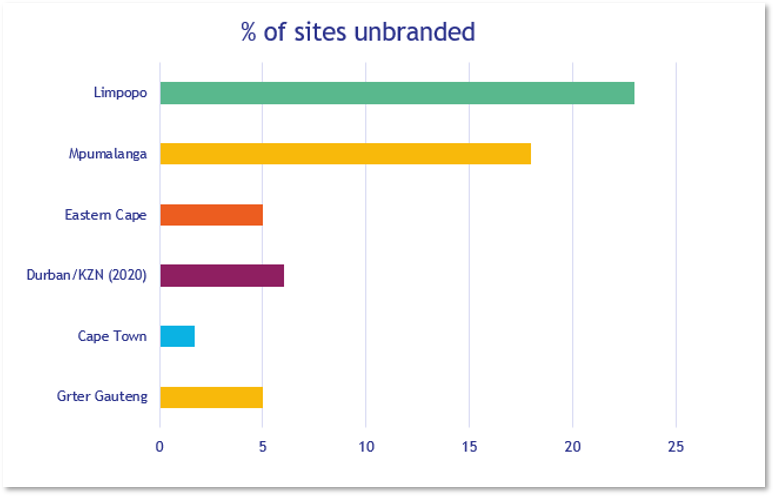
The number of sites in Mpumalanga has increased by 26 in the past 12 months with a further 11 sites under construction. With saturation of the 3 key markets of Gauteng, KZN/Durban and Cape Town, investors have identified this market as a new growth area where property is less prohibitively expensive and barriers to entry are lower. This is reflected in the lower combined market share of the top 4 players as compared to the top 3 SA markets. In Mpumalanga, the top 4 brands hold 68% market share as opposed to approximately 80% in Cape Town and Durban/KZN. Unbranded independent sites make up 20% of the Mpumalanga market, far higher than the 3 top SA markets where independents only hold 5% or less of the sites.
The size of the Mpumalanga market and the number of sites has taken many by surprise. The robustness of the average fuel throughput per site at 247kl/mth makes Mpumalanga a market to consider for future investment. The large number of independent sites and smaller brand networks offers acquisition opportunities for investors. Understanding the volume potential of acquisition candidates is key to a successful investment strategy and made possible through the data surveyed and modelled by Kalibrate.
Limpopo
Limpopo province in the far northeast of South Africa borders of Gauteng and Mpumalanga as well as neighbouring countries of Zimbabwe, Botswana, and Mozambique. It is the second poorest province in terms of GDP per capita and, like Mpumalanga, has seen a contraction in economic growth in the last few years due to the pandemic.
Despite being a less attractive region overall from an economic growth perspective, there is interest amongst oil companies in pockets of attractive opportunities. Key towns across Limpopo offer opportunities for investment such as the capital, Polokwane plus other major towns including Bela-Bela (Warmbad), Lephalale (Ellisras), Makhado (Louis Trichardt), Musina (Messina), Thabazimbi and Tzaneen. Transient routes to neighboring countries pass through Limpopo.
In terms of petrol sales, Limpopo is on a par with the Eastern Cape and Mpumalanga markets but with more service stations (510) this has resulted in a lower fuel throughput per site of 214 Kl/mth. 12 new sites were built since the survey in 2020 and there are an additional 8 under construction. This points to a possible over-supply of service stations and potentially a need for optimization by some of the networks. In this province, the top 4 brands have a combined market share of 50%, the lowest combined share of the market of all 6 markets Kalibrate has surveyed. Total is the market leader. This is Sasol’s third strongest market which reflects their wish to remain invested where they have supply advantage. This market has a high percentage of independently owned sites (23%)
Shop average revenue per site is less than half that of Cape Town and Gauteng reflecting the lower average earning power in this region and also the lower investment of the major international oil companies in this region.
There is increasing interest in this province for expansion and investment as the more attractive regions in South Africa become saturated and expensive. With the right know-how, it is possible for oil companies to cherry pick the best possible acquisition candidates in specific micro markets/nodes of growth within the province.
Conclusion
Traditionally, most the major oil companies have concentrated investment in the three key markets in South Africa namely, Gauteng, Cape Town and Durban/KZN. These areas are South Africa’s economic hubs where wealth is concentrated. IN addition, these markets have their own refineries, making them significantly supply advantaged. As these key markets have matured, they are becoming saturated and opportunities to grow are becoming more challenging. Oil companies in these markets are looking at how best to optimize their existing networks rather than expanding and building new sites where local authority approvals can delay projects for up to five years or more. Kalibrate is able to assist clients to optimize their networks by identifying those sites that have untapped volume potential.
With the three markets, i.e. Gauteng, Durban/KZN and Cape Town becoming more and more challenging to invest in, oil companies are looking further afield. The Eastern Cape is becoming more attractive as a market for service station investment due to the recent boom in property development as office workers are now free to live in these beautiful coastal towns rather than in the three major centres of South Africa.
The markets of Mpumalanga and Limpopo, although poor economically by comparison to the three markets of Gauteng, Durban/KZN and Cape Town are becoming increasingly of interest to oil companies who are looking for pockets of high potential growth within these regions. Investment opportunities in these markets are becoming more attractive both in terms of acquisition candidates due to the proportionately larger percentage of independently owned service stations and new builds due to the proportionately lower cost of land.
The key to successful performance in all the South African markets is to identify the best opportunities for investment, either through rebuild/upgrade of existing sites, acquisition of smaller brands and independently owned sites, or new builds on greenfield land. Kalibrate specializes in knowing which investment opportunities will bring the highest volumes and shop turnovers on a site-by-site basis for all these scenarios and markets.
Read more articles about:
Location intelligenceSubscribe and get the latest updates
You may unsubscribe from our mailing list at any time. To understand how and why we process your data, please see our Privacy & Cookies Policy
Related Resources
Location intelligence
Five burger companies, five problems
These burger brands had challenges from international growth to understanding franchise locations cannibalization,...
Location intelligence
Market Optimizer: Demo video
Market Optimizer allows users to strategically grow their network in existing markets while balancing revenue...