Why performance is key to unearthing site potential and unlocking network value

There are many factors to consider in optimizing network performance, and individual site volume and convenience sales are two of the most critical. These factors tell you a lot, but they can’t paint the whole picture. Only understanding a site’s full potential can do that.
That’s why Potential Performance Quadrant (PPQ) analysis is a vital first step to truly effective network optimization. It helps fuel and convenience retailers understand the truth of individual site performance, examine their existing portfolio, and make decisions relating to single site or whole network acquisitions.
Retailers know their networks well, but without measuring opportunity (or lack thereof), they can’t develop truly well-defined, reliable network optimization strategies.
How to approach PPQ analysis
PPQ analysis allows you to unlock opportunities and avoid investment pitfalls by showing you individual sites, and your network as a whole, in greater detail. It takes one dimensional site understanding, and turns it into 3D.
Understanding in three dimensions:
- Knowing how your site is performing in terms of throughput and turnover. This is where many retailers’ site knowledge typically finishes.
- Examining the market average, which comprises competitor performance for the market. Once you understand how the competition is performing, you can benchmark your own sites within the market.
- Understanding the potential in your own sites, and any you may look to acquire. While previously, you could compare one site to another in terms of volume, you lacked insight into potential.
Failing to understand site potential can lead to poor decision making. In the case of network rationalization, if you look simply at current performance of a location, you might close a site that has good potential. You can see how retailers fall into the trap of divesting poorly performing sites without seeing the bigger picture, and we do, unfortunately, have examples of clients that have sold off sites that they shouldn’t have — prior to using our PPQ analysis.
How to evaluate potential performance
The first step to understanding site potential is to examine the “dirt strength” of the site. Its location and market. Perhaps your site is in a trade area with minimal competition on a busy intersection with plenty of local demand. This combination of characteristics would mean a site with great dirt strength. If a site like this is performing badly, you can see it’s not living up to its potential, and devise a strategy for improvement.
A PPQ analysis takes all your subject sites, and maps them into potential performance quadrants.
So, what do the potential performance quadrants look like?
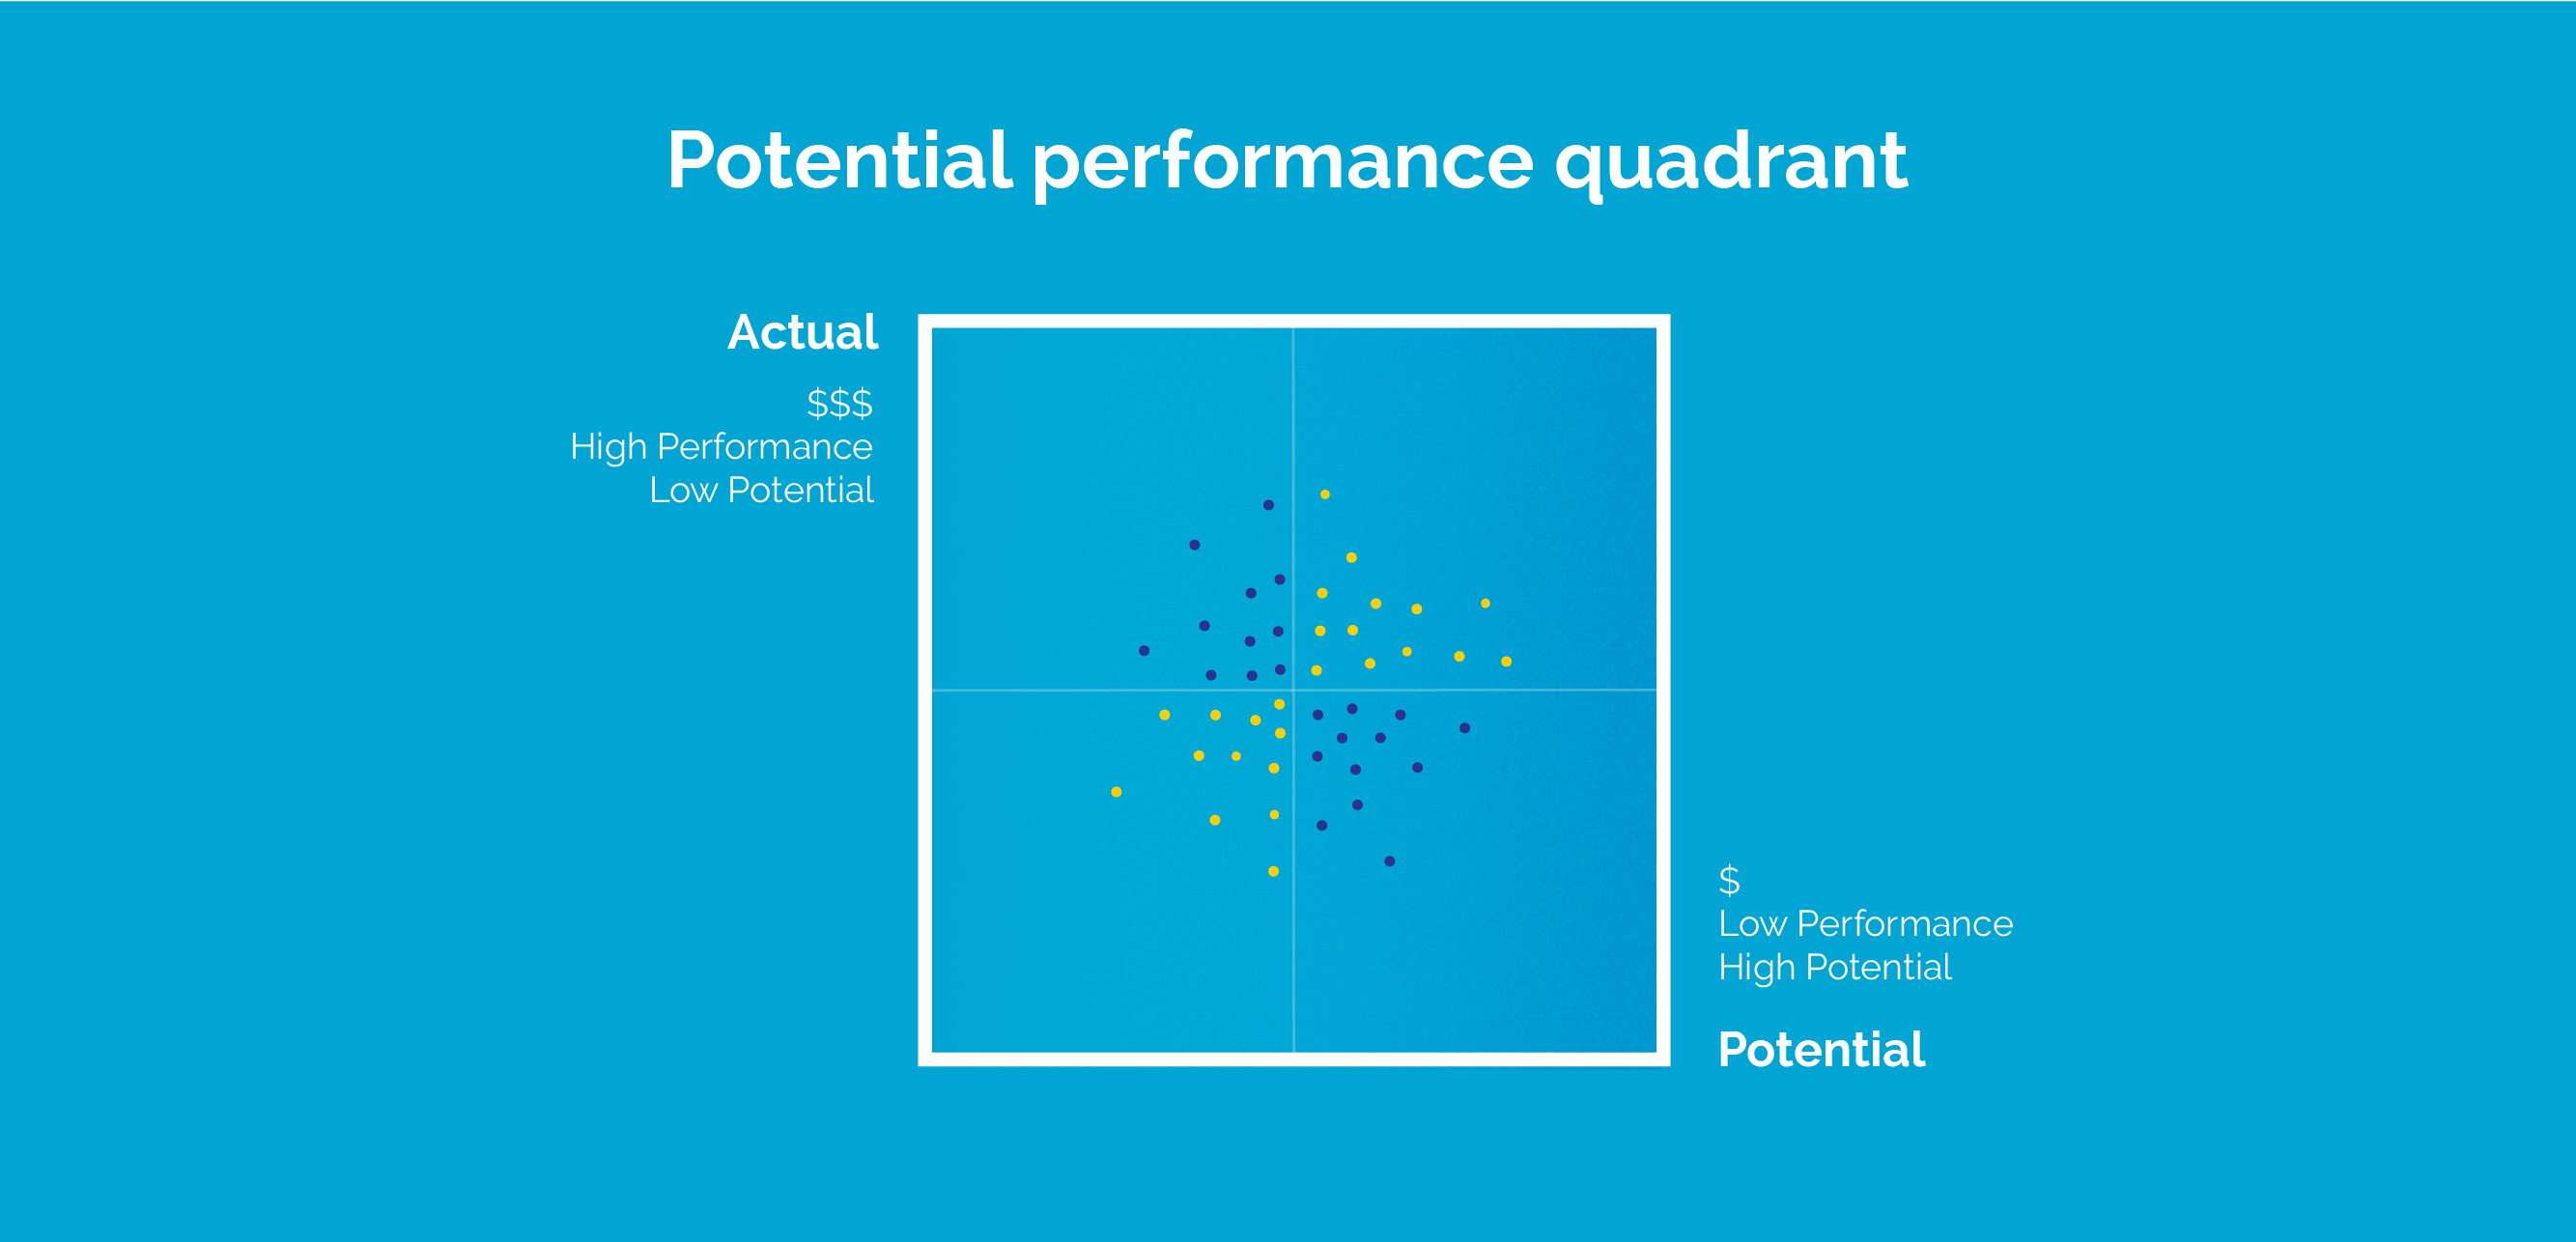
High Performance/Low Potential: above average sales, below average locations. Outperforming their projected location strength volume. This is often due to little competition in the area on better real estate.
How to proceed: these sites are vulnerable to competitors opening stronger sites close by. Most companies retain these sites because of their superior performance, but keep an eye on competitor developments.
High Performance/High Potential: high performing sites in the network (the stars), having above average sales and strong location strength.
How to proceed: this is the quadrant that requires protection from competitor takeover attempts. Don’t become complacent with them!
Low Performance/Low Potential: poor performing sites with below average sales and locations. These are commonly small and poorly maintained sites with possible negative consequences for the brand image of the network.
How to proceed: the sites falling into this quadrant are often reviewed for possible divestment or closure.
Low Performance/High Potential: below average volumes with above average locations.
How to proceed: this quadrant reflects the best opportunity for improving sales volumes in the network.
Picking up where PPQ leaves off
So, now you know your sites’ reality and potential opportunity. What’s next? PPQ analysis should be a springboard for action. The next step is to dig into why particular sites are under- or over-performing, and start to model changes to explore the impact of potential solutions.
Underperforming sites: if you’ve established you have high dirt strength, it’s time to examine your other site characteristics find out what’s going wrong. Do you have enough pumps? How strong is your brand? How strong are your facilities? Are they well kept? Are your competition particularly strong, and if so, how? Using Kalibrate’s 7 Elements framework will help you answer these questions and more.
Then look at the more intangible elements of your site offer. For example how is the service? Is the site often congested? These sort of considerations might be difficult to put a number on, but they contribute to driving people away.
It is often possible to rebuild or make changes that steer these sites towards the high performance/high potential quadrant. By running simulations through the Kalibrate Retail Network Planning Model, you can project fuel volume and c-store uplift by testing different operational scenarios.
Overperforming sites: let’s look at an example. You’re looking to acquire a new site. You find one that is performing well, with a healthy amount of throughput and a great convenience offer. It’s important to understand the true potential of the site. If the dirt strength is poor, it suggests your seller could be pumping a lot of investment into that site to raise its value.
Using the PPQ analysis, you’ll understand the site’s true potential, and that you can’t actually rely on the high throughput. Sites that are outperforming their dirt need to keep really aggressive prices or outstanding execution, or performance can quickly wane. Maybe that star performer isn’t such a valuable asset after all.
Final thoughts
Portfolio optimization isn’t just about understanding the current performance of your assets, or the assets you’re interested in. It’s about understanding their potential. To undertake a genuinely valuable strategic review of your network, you need to understand the natural placement of sites in the PPQ, so you know where to invest and where to think about divesting.
Once you’ve got this 3D view, you have an opportunity you can take advantage of. Kalibrate can help you exploit the information presented through PPQ analysis, using the insights gleaned to put an action plan in place.
If you’re ready to take that first step towards deeper network knowledge, reach out to learn more about PPQ analysis.
Read more articles about:
Location intelligenceSubscribe and get the latest updates
You may unsubscribe from our mailing list at any time. To understand how and why we process your data, please see our Privacy & Cookies Policy
Related posts
Location intelligence
Five burger companies, five problems
These burger brands had challenges from international growth to understanding franchise locations cannibalization,...

Location intelligence
Market Optimizer: Demo video
Market Optimizer allows users to strategically grow their network in existing markets while balancing revenue...