Various factors are impacting the South African fuel retail market, including economic pressures, regulatory changes, and evolving consumer preferences. These dynamics are creating challenges and opportunities for retailers. Understanding these trends is crucial for businesses looking to navigate this complex landscape successfully. As the market evolves, strategic decisions around site selection and operational efficiency will be key to maintaining competitiveness.
Kalibrate has a deep understanding of our clients’ markets, enabling us to offer the insights needed to inform location strategy decisions. By removing uncertainty from fuel network planning, we help retailers maximize the returns on their capital investments.
In this article, we delve into the South African fuel market by analyzing seven key regions. This detailed examination allows us to pinpoint opportunities for fuel retailers seeking growth or optimization.
Overview
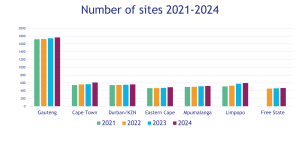
According to an article by the National Empowerment Fund (NEF), there are over 6,000 service stations in South Africa. Kalibrate has surveyed and developed models for more than 5,000 of these stations across key markets, including Gauteng, Cape Town, Durban, Eastern Cape, Mpumalanga, Limpopo, and Free State.
Across the country, approximately 30bn liters of fuel is consumed per year, with Gauteng, Kwa-Zulu Natal and Cape Town consuming 20bn litres (67%) of the total amount.
Of the approximately 11.8bn liters of petrol consumed in South Africa in 2023, we’ve surveyed and modelled service stations covering approximately 87% of this volume. Kalibrate helps clients benchmark and rank markets, providing valuable insights into the scale of opportunities and their competitive situation.
There have been some big announcements and interesting changes amongst the oil majors over the past three to four years in South Africa:
- Glencore acquired Chevron’s Caltex-branded service station network in South Africa in 2018. The rebranding of these stations to Astron Energy is progressing rapidly, with nearly 50% of the network now showcasing the new Astron Energy colors.
- Engen and Vivo Energy successfully completed a merger in South Africa earlier this year and announced their commitment to invest and expand operations in South Africa.
- In May 2024, Shell announced their intent to exit shareholding its South African Retail operations.
- Following closely on Shell’s announcement, BP announced their long-term strategy to invest in South Africa.
- South Africa’s oil refining capacity has significantly declined, dropping from 520,000 barrels per day in 2018 to approximately 358,000 barrels per day.
This reduction is primarily due to the mothballing of the Sapref refinery (a joint venture between BP and Shell) in Durban in 2020, followed by the closure of Engen’s Enref Refinery in 2022. Additionally, the Mosgas facility in Mossel Bay, which produced oil from gas, has also been mothballed due to a lack of feedstock. As a result, only three refineries remain operational: the Astron Refinery in Cape Town, Natref in Sasolburg, and the Sasol Synfuels Refinery in Secunda, Free State.
Since 2022, fuel volume demand across the seven markets surveyed by Kalibrate has declined by 1.8%, reflecting a drop between 2022 and 2024. However, there has been a positive trend from 2023 to 2024, aligning with the forecasts made by South African economists for growth over the next five years. This recent upswing indicates a potential recovery in the fuel market, suggesting a more stable demand trajectory in the coming years.
According to Modor Intelligence, economic growth in South Africa is expected to result in a fuel CAGR (compound annual growth rate) of 1.3% between 2024 – 2029. Factors influencing this are increasing infrastructure development activities in the country, the growing population, and subsequently, the increasing consumption of petrol products
Despite all the changes to the fuel industry landscape in South Africa recently, the outlook for investment and growth remains positive.
Kalibrate has been surveying and modelling Gauteng, Cape Town, Durban/KwaZulu-Natal and Eastern Cape for our South African clients for more than 20 years. More recently, we have started surveying and modelling Limpopo, Mpumalanga, and Free State as retailers have identified the attractiveness of these markets as regions for future investment opportunities.
Gauteng
Gauteng is South Africa’s major economic hub and the largest market by far. It accounts for close to 40% of the country’s retail fuel demand with over 1,750 service stations. Gauteng, although the smallest geographically of the nine provinces in South Africa, has the largest economy contributing 33% of the country’s GDP (gross domestic product) in 2022 according to Stats SA.
Furthermore, Gauteng is the most attractive market in terms of demand and growth potential, boasting the highest GDP growth rate of all provinces at 2.8% in 2022.
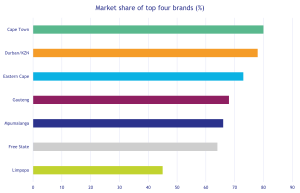
It has the highest volume throughput per site of all markets surveyed with an average combined fuel volume of 282kl/mth in 2024, down slightly from 304kl/mth in 2022. This decline is due to the drop in overall fuel demand between 2022 and 2024 and the increase in number of service stations. The number of service stations has grown since 2022 by an additional 40 new sites and a further 39 service stations are currently under construction. The four top brands in the market hold 68% of market share, whilst 91% of the volumes are controlled through six of the Major Oil companies.
The market leader holds a 27% share of the combined fuel market, leading the second-largest company by a significant 12%. Site numbers are steadily increasing in Gauteng, as they are across all the markets surveyed by Kalibrate.
With 19 brands competing in this market—more than in any other region of South Africa—there’s clear evidence of growth among independent oil companies. This creates a highly competitive environment where successful investment hinges on identifying the most promising locations. Understanding where the high-demand areas, or “hot spots,” are, will be crucial for maximizing returns and gaining a competitive edge.
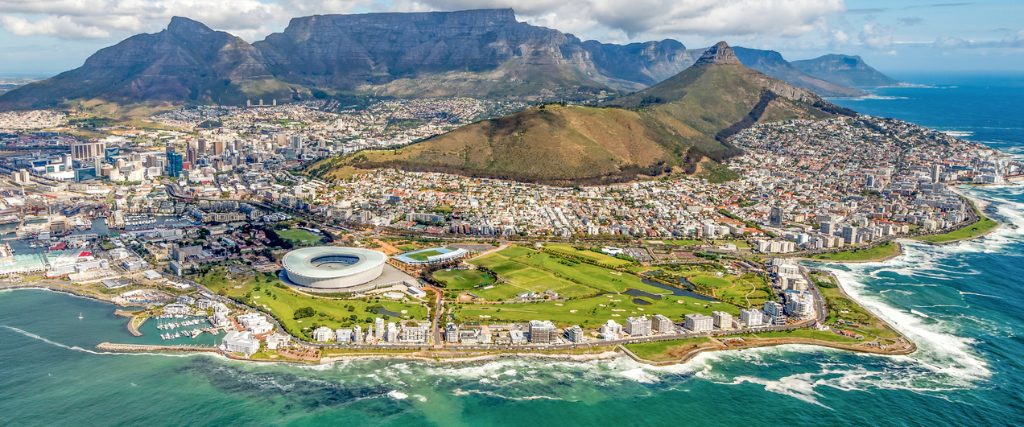
Cape Town
The Western Cape Province had the second highest GDP growth in 2022 with 2.6%, closely following Gauteng. It had the third highest contribution to the country’s GDP at 13.9% just behind KwaZulu Natal at 15.9%. The three provinces of Gauteng, KwaZulu Natal and Western Cape combined account for 63% of the country’s GDP.
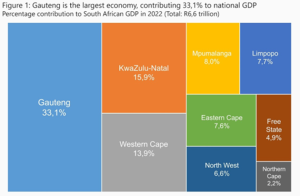
Source: https://www.statssa.gov.za/wp-content/uploads/2023/09/ProvGDPPc1.jpg
Cape Town is an attractive market with the second highest petrol demand behind Gauteng. Average combined fuel of 260 kl/mth per site is the third most attractive throughput in the seven markets surveyed and falls just behind Durban/KZN.
This market is dominated by four major international oil companies, which together control 83% of the market share. Compared to Gauteng, there are fewer brands operating in this region. Additionally, land availability is limited, leading to intense competition for the remaining opportunities. Acquisition of existing sites or rebuilding of existing sites may be a more effective way to grow in this market. By analysing Kalibrate’s Performance Potential Quadrant Analysis (PPQ) charts, it is evident that there are high potential opportunities for acquisition of existing sites amongst unbranded and independent sites. By using Kalibrate’s model, these sites can be identified and their potential volumes (over and above their actual volumes) can be established. The number of sites under construction in this market has declined from 15 in 2019 to just 7 in 2024, signalling a slowdown in new development. This decrease is attributed to factors such as limited land availability and lengthy approval processes from local authorities.
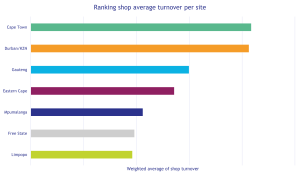
Cape Town has long been the testing ground for international oil companies to pilot new shop concepts intended for global markets. This focus has resulted in a world-class retail offering at many service stations. As a result, Cape Town boasts the highest shop revenue per site among the seven South African markets surveyed.
Durban/KZN
The surveyed area covers Durban, Pietermaritzburg, and the coastal region stretching from Richards Bay in the north to Port Edward in the south.
KZN contributed the second largest share to South Africa’s GDP in 2022, accounting for 15.9%, but ranked fifth in GDP growth, with only a 1.1% increase. The province’s economy has been hindered by the civil unrest in 2021 and significant delays at the major ports of Durban and Richards Bay. However, efforts to enhance port operations and the Central Energy Fund’s plans to reopen the former BP and Shell Sapref refinery in Durban are expected to support the region’s long-term economic recovery.
Durban is a key economic geography in South Africa, being a major import/export hub for importation of crude and refined fuels, and major fuel pipelines connecting Durban to the Gauteng market.
Durban/KZN has around 553 retail service stations, a network comparable in size to the Cape Town metropolitan area. However, Durban/KZN has a higher average fuel throughput per site, mainly due to greater diesel volumes compared to Cape Town. Additionally, shop turnover per site is notably high, ranking just behind Cape Town and ahead of Gauteng.
The top four brands in this market have a combined market share of 78%. There are more independent brands in Durban/KZN than in Gauteng and Cape Town indicating opportunities for acquisition and new investors.
Eastern Cape
The Eastern Cape has historically suffered from high unemployment and a weak economy. The province contributes 7.6% to GDP, ranking 7th out of the nine provinces in terms of GDP output. The province is technically in recession having experienced three consecutive economic contractions up to Q1 2024. However, there are many areas along the Eastern Cape coastline that are very attractive tourist destinations resulting in pockets of attractive growth and opportunity.
Since the COVID-19 pandemic and the shift to remote work, many city dwellers are relocating to the picturesque coastal towns of the Eastern Cape. Freed from the constraints of city-based jobs, this trend is sparking a mini boom in both property and population growth in these appealing seaside communities.
Kalibrate’s Eastern Cape market study area stretches along the coast from Port Edward in the north to Mossel Bay in the south and incorporates the inland town of Queenstown. Key growth areas along the coast in this market include the holiday towns of George, Mossel Bay, Knysna, Plettenberg Bay, Cape St Francis, Kenton on Sea and Port Alfred.
There are currently 490 service stations in this market and the top four brands account for 73% of market share. At the time of survey, there were 13 sites under construction in 2024 compared to 6 in 2022. The number of open sites increased by 15 between 2023 and 2024, indicating interest by oil companies in investment in this region.
With an average fuel throughput of 247 kl/month per site, service stations continue to generate attractive returns, particularly when located in growth areas. By analyzing market growth pockets using Kalibrate’s micro-market studies, investors can identify the best opportunities for establishing new service stations or refurbishing existing sites.
To succeed in this market, it’s crucial to identify high-potential areas that are poised for growth and capitalize on the opportunities they present.
Mpumalanga
Mpumalanga contributes the fourth highest percentage to the national GDP at 8% despite being the second smallest geographic region behind Gauteng. It benefits from its proximity to Gauteng and advantageous fuel supply routes through the Maputo Development Corridor. After showing contraction in fuel demand between 2020 and 2023, there has been an encouraging recovery in 2024 with volumes increasing by more than 3%.
Kalibrate has conducted a comprehensive survey of all retail service stations in Mpumalanga. Fuel sales in this region closely mirror those in the surveyed areas of the Eastern Cape and Limpopo. In 2024, Mpumalanga’s average fuel throughput per site stands at 234 kl/mth, slightly below the Eastern Cape but higher than in Limpopo and the Free State. Mpumalanga hosts 522 service stations compared to the Eastern Cape’s 490. Diesel volumes per site are robust in Mpumalanga, like those in the Eastern Cape and Durban, likely due to higher levels of transient traffic.
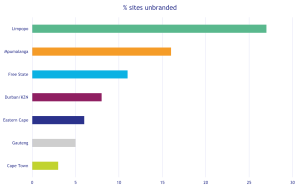
The number of open sites in Mpumalanga has increased by 14 in the past 12 months, with a further 8 sites under construction. With saturation of the three key markets of Gauteng, KZN/Durban and Cape Town, investors have identified this market as a new growth area where property is less prohibitively expensive and barriers to entry are lower. This is reflected in the lower combined market share of the top four players as compared to the top three SA markets. In Mpumalanga, the top four brands hold 66% market share as opposed to approximately 80% in Cape Town and Durban/KZN. Unbranded independent sites make up 16% of the Mpumalanga market, far higher than the three top SA markets where independents only hold 5% or less of the sites.
The size of the Mpumalanga market and the number of sites has taken many by surprise. The robustness of the average fuel throughput per site at 237kl/mth makes Mpumalanga a market to consider for future investment. The large number of independent sites and smaller brand networks offers acquisition opportunities for investors. Understanding the volume potential of acquisition candidates is key to a successful investment strategy and made possible through the data surveyed and modelled by Kalibrate.
Limpopo
Limpopo province in the far northeast of South Africa borders on Gauteng and Mpumalanga as well as neighboring countries of Zimbabwe, Botswana, and Mozambique. It is similar in the size of contribution it makes to national GDP as Mpumalanga at 7.7%. As in the case of Mpumalanga, Limpopo province has also experienced contraction in fuel volume between 2021 and 2022 but grew year on year since then by approximately 2% per annum.
Like Mpumalanga, Limpopo is increasingly attracting the attention of oil companies seeking new investment opportunities. There is growing interest in specific areas with promising potential. Key towns across Limpopo, including the capital Polokwane, as well as Bela-Bela (Warmbad), Lephalale (Ellisras), Makhado (Louis Trichardt), Musina (Messina), Thabazimbi, and Tzaneen, present significant investment prospects. Additionally, Limpopo’s strategic location along transient routes to neighboring countries enhances its appeal to investors.
In terms of fuel sales, Limpopo is comparable to the Eastern Cape and Mpumalanga markets. However, with 597 service stations, the higher number of sites has led to a lower average fuel throughput of 206 kl/mth per site. Since 2023, 17 new stations have been built, with another 17 currently under construction. This growth suggests a possible oversupply of service stations, indicating that some networks may need to consider optimization. In Limpopo, the top four brands collectively hold only 45% of the market share, the lowest among the seven markets surveyed by Kalibrate. Notably, Limpopo is the only province where TotalEnergies leads the market, with approximately 13.5% share. Additionally, a significant 27% of sites are independently owned, capturing nearly 10% of the market’s fuel volume.
Shop average revenue per site is less than half that of Cape Town and Durban, reflecting the lower average earning power in this region and the lower investment of the major international oil companies.
As the more desirable regions in South Africa become saturated and costly, interest in expansion and investment in this province is on the rise. With the right expertise, oil companies can strategically select the most promising acquisition opportunities within specific micro-markets or growth nodes across the province.
Free State
Free State province is the most recent market that Kalibrate has surveyed in South Africa at the request of some of our clients. It is a lot smaller than the other six markets in terms of contribution to the national GDP at only 4.9%, however GDP growth in 2022 was 1.5% (above Mpumalanga, Limpopo and KwaZulu-Natal).
Although fuel volumes have remained flat over the three years since Kalibrate started surveying this market in 2022, the South African government predicts growth between 2021 and 2026 of 1.45% largely driven by the finance sector. This market could be attractive to investors interested in transient traffic service station investment, as it is at the confluence of major logistics arterials such as the N1, N6, N5, N8, and N3.
The Free State has the lowest fuel demand among all regions, with sales 15% lower than Mpumalanga, the next smallest market. However, with an average fuel throughput of 218 kl/mth per site, Free State stations perform slightly better on average than those in Limpopo, primarily due to the region’s smaller number of sites, totalling 470. Between 2023 and 2024, only one new site opened, with an additional seven currently under construction.
Similar to Limpopo and Mpumalanga, the Free State has a greater number of brands in the market compared to Gauteng, Durban, Cape Town, and the Eastern Cape. The top four brands collectively hold 64% of the market, with one leading brand dominating nearly 30% of the market share.
Average shop turnover per month is almost half of the turnover achieved by convenience stores in Cape Town and Durban, reflecting the lower per capita income and weaker economy.
As opportunities for network expansion become more challenging in the top three key South African markets, investors are looking further afield for pockets of growth opportunity. Free State is one of the markets of interest, particularly the key arterial roads that pass through this province.
Conclusion
Traditionally, major oil companies have focused their investments on South Africa’s three key markets: Gauteng, Cape Town, and Durban/KZN. These regions serve as the country’s economic hubs, where wealth is concentrated, and they benefit from the presence of refineries and ports, offering a significant supply advantage. However, as these markets have matured, they have become increasingly saturated, making growth opportunities more difficult to find. Consequently, companies in these areas are now focusing on optimizing their existing networks rather than expanding or building new sites, especially given that local authority approvals can delay projects for five years or more. Kalibrate can assist clients in optimizing their networks by identifying sites with untapped volume potential.
As investing in the three major markets—Gauteng, Durban/KZN, and Cape Town—becomes increasingly challenging, oil companies are turning their attention to other regions. The Eastern Cape is emerging as an attractive market for service station investment, driven by a recent surge in property development. With more office workers now free to live in these scenic coastal towns instead of the three main centers of South Africa, the region offers promising opportunities for growth.