The Census and data granularity

The 2020 census data is (finally) here! Once a decade the Census Bureau tabulates and releases the findings of the decennial census questionnaire sent to every U.S. household. While this has obvious implications in terms of updating critical information such as population, household count, income, living quarter types, there is a somewhat less well-known process that re–draws the geographic extents on which those pieces of information are measured. This is quite important when modeling trade area sector-specific levels of geography, as we do here at Kalibrate.
Census: data collection and methodology overview
For the uninitiated, the U.S. Census Bureau uses several geographic levels to organize and report data. These levels, listed from smallest to largest, are as follows:
- Block
- Block Group
- Tract
- County
- Metropolitan Statistical Area (MSA)
- State
- Region
- Country
For illustrative purposes, a typical census block group has an average population of roughly 1500 people. The 2010 Census included an approximate total of 220,000 block groups. The new 2020 Census now has approximately 240,000 block groups, representing a nearly 10% increase in the number of uniquely defined geographies. Increased granularity can be immensely impactful to the underlying analyses associated with the development of predictive solutions.
Quantifying change: growth
By means of example, consider this census block group in southwest Houston TX (near Katy).
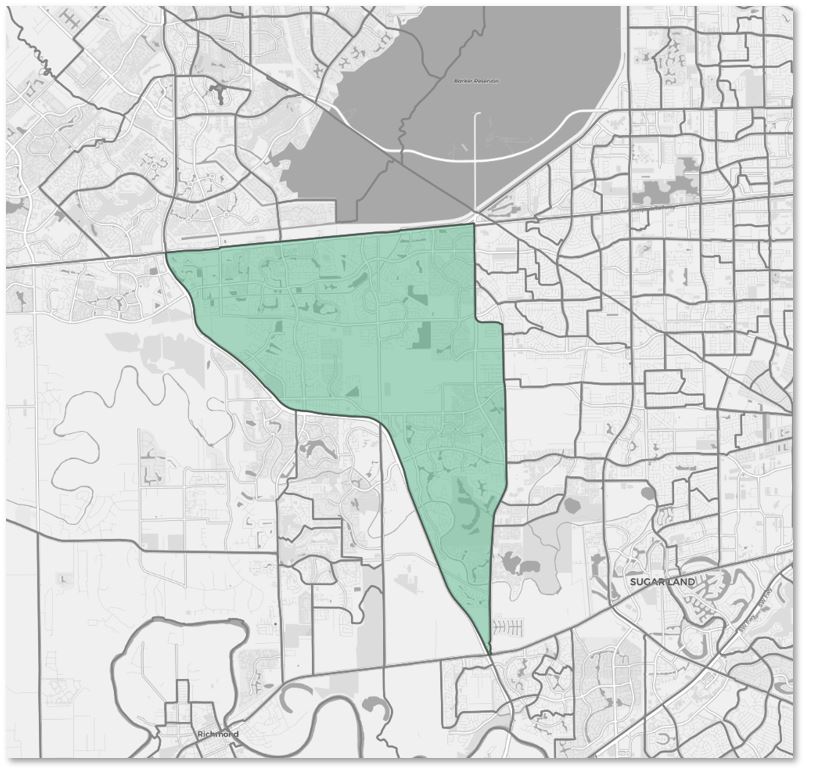
As you might expect, this area has seen tremendous growth over the past decade. In fact, this was the most populated block group in the entire country based on 2010 boundaries. Therefore, it was unsurprisingly destined to be split during the 2020 redevelopment process, but to what extent was the question. The answer was…a lot!

To be precise, an increase from one in 2010 to 17 block groups in 2020. While this is the starkest example of the kinds of change that can occur in a census update, it is a clear demonstration of the importance of having up-to-date geographic data feeding into all analytic and modeling efforts.
Finally, it is worth mentioning that the census does more than just split high-growth areas into more geographies. Albeit less frequent, there are instances of block groups merging in areas where the population may have declined. Later this year we’ll come back to this topic and provide some analytical examples of how these changes are practically improving the solutions being leveraged by our clients.
Lessons from census data
While the relative importance of census data can vary within analytical methodologies, the broader point about change is instructive. By ensuring data is as contemporary and granular as possible, decision-makers can achieve greater reliability in a model-build process while reducing the likelihood of unreliable outputs.
As retailers scale, maintaining multiple data sources with differing update frequencies, granularity, or coverage becomes challenging. When our analytical teams begin a project with a client, we always start by understanding the concept and objectives, because that helps us determine the most relevant data sources to enrich the client’s own insight and the frequency of model refreshes required. Different verticals, concepts, and markets all demand different approaches. By extension, the need for using the most up-to-date data sources – and the consequences of adopting vintaged data feeds – will occasionally be limited, but more often highly significant to the efficacy of analytical tools.
Read more articles about:
Location intelligenceSubscribe and get the latest updates
You may unsubscribe from our mailing list at any time. To understand how and why we process your data, please see our Privacy & Cookies Policy
Related resources
Location intelligence
Market Optimizer: Demo video
Market Optimizer allows users to strategically grow their network in existing markets while balancing revenue...
Fuel pricing
The Kalibrate news round-up: June 2025
In this monthly feature, we look across the industry and mainstream news to uncover stories of note that we think are...