Understand ever-changing market conditions with mobility data: part one
The fuel and convenience retail landscape has changed beyond recognition. In these unprecedented times, retailers are scrambling to adapt their businesses to meet ever-changing consumer needs.
In an attempt to make informed decisions, anecdotal evidence and disparate data sources are being used to react to changing market conditions and question investment plans. This dizzying mishmash of often-outdated information provides a fragmented and hazy perspective. The very best retailers use comprehensive decision-support solutions to base decisions on accurate, current market data.
So, how can retailers use mobility insights, gleaned from mobile location data, to understand and adapt to ever-evolving gas, c-store, and quick service restaurant (QSR) market conditions?
Creating geofences to accurately capture near real-time data.
Mobility data is generated through mobile phone activity at specific points of interest (POI). This highly accurate POI data, combined with verified geofences, allows Kalibrate experts to understand the number of people visiting gas stations, c-stores, and QSRs.
This case study focuses on a region spanning Georgia and South Carolina, covering a coastal zone around Savannah and Charleston. Over 2,000 locations are included in the analysis. Each location has a geofence defined (shown right) to accurately capture site visits in near real-time. Hundreds of thousands of data points were gathered before and after COVID-19-related events. This provides an objective, accurate view of how market dynamics and the competitive landscape are evolving in an ever-changing world.

This approach, and the data sources used, can be applied to many markets around the globe.
What does the data tell us about the “new normal”?
Examine the chart below. Before the COVID-19 outbreak, a regular, seven-day pattern can be seen across gas stations and QSRs. Upon the State of Emergency being declared, there was a significant downturn in demand. The weekend following the announcement, the number of visits fell by as much as 70% at stand-alone QSRs, and 60% at gas stations and convenience stores. The following Monday, as fewer people travelled to work, a new weekly demand pattern emerged.
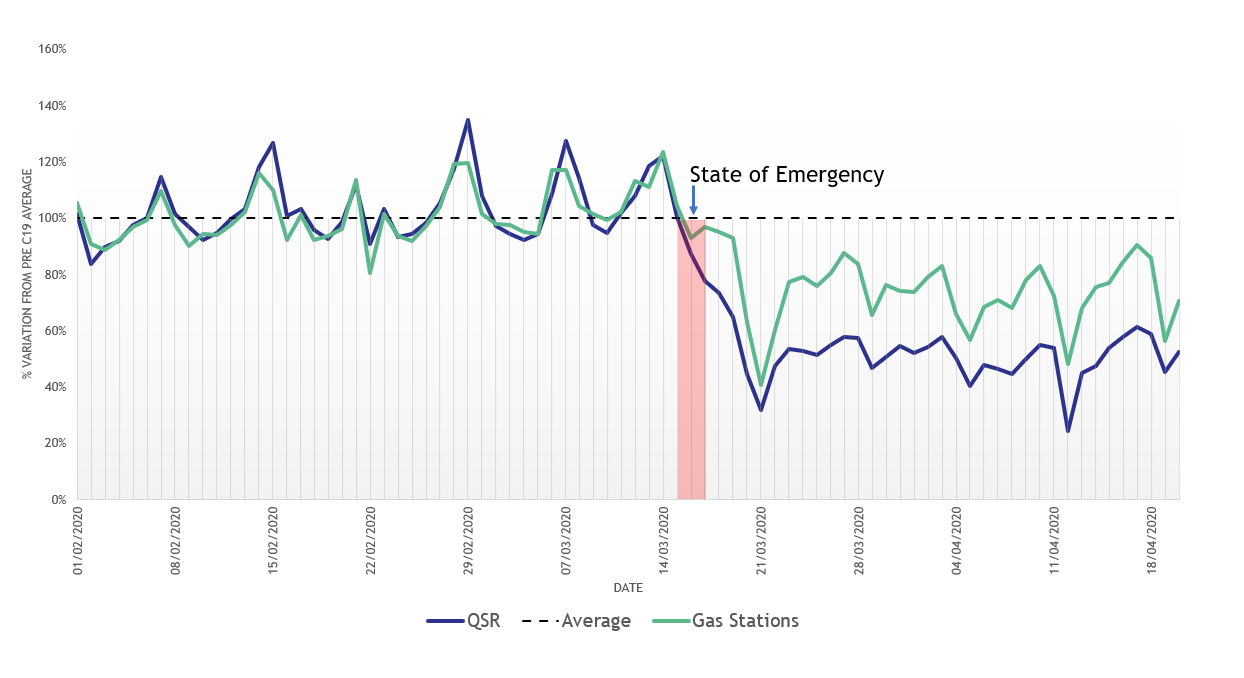
As more people choose to stay at home, and as dine-in options are restricted, average daily QSR visits are down 50% on average. Gas stations and convenience store visits are down by 29% on average, as people fill up less but choose quick and convenient food alternatives.
When comparing urban and rural sites, we can see that locations in urban areas are impacted as much as 10% more than rural sites, as fewer people travel into cities to work.
What does a slow-down in movement look like?
Analyzing the impact from a spatial perspective shows the sheer difference in people’s movement patterns before and after COVID-19 restrictions were put in place.
While the number of visits is down across all sites, residential areas continue to be demand hotspots.
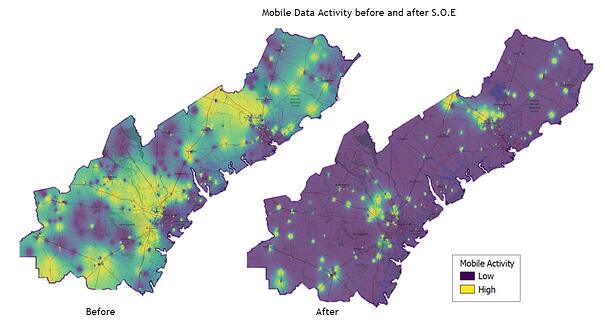
Transient sites such as those on key commuter routes are impacted more significantly.
Are we choosing convenience over brand loyalty?
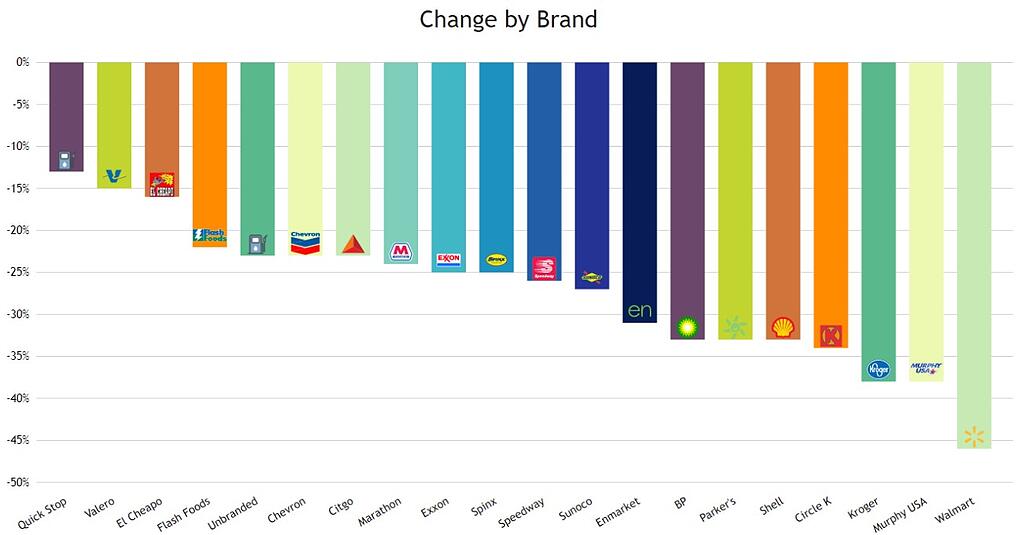
In short, yes. Our data has shown that some locations have been impacted more than others. When analyzing the percentage impact by brand we can also see that some are impacted more than others. Larger, more well-established brands such as Walmart, Murphy, and Kroger have seen the largest percentage decrease in visits.
As consumers limit their grocery shops to one or two per week, there are fewer opportunities to refuel at the same time. It also appears that while fewer journeys are made and people stay closer to home, they are more inclined to put aside their brand loyalty and to choose a local offering. Consumers are less inclined to go out of their way.
How is social distancing impacting daily demand?
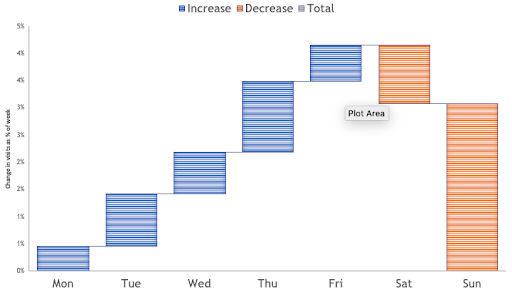
As life is disrupted and the public stays home, making essential journeys only, we can see that people tend to stay in on weekends. A higher percentage of the total trips made to a gas station, c-store, or QSR is made from Monday to Friday.
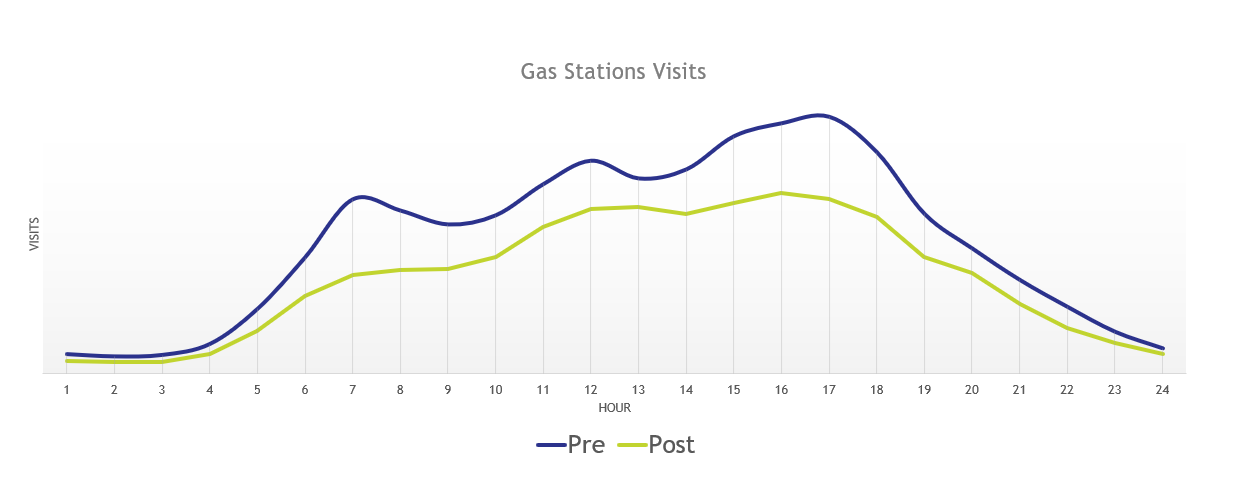
The weekday spikes in demand we typically see during the morning, at lunchtime, and in the evening rush hour, are no more. As people avoid busy periods and there are fewer people commuting, we observe a lower sustained demand throughout the day.
This is particularly prominent when looking at food offerings.
How can mobility data help retailers survive?
Now more than ever, retailers need accurate visibility into current market conditions. As restrictions are slowly lifted, and we begin the long journey towards normality, social distancing will be a key part of daily life. People’s movement patterns, schedules, and purchasing decisions will change as a result.
Retailers will need to rethink the fundamentals of their offerings and ensure that capital and operational investment decisions are made using sound judgement and current, accurate market insights. Speak to one of Kalibrate’s experts about how we’re leveraging this type of mobile data within our core planning solution.
Co-authors
Brendon Edwards — GIS Research Analyst
Rich Wilcox — VP Data Operations
Read more articles about:
Location intelligenceSubscribe and get the latest updates
You may unsubscribe from our mailing list at any time. To understand how and why we process your data, please see our Privacy & Cookies Policy
Related posts
Uncategorized
Understand ever-changing market conditions with mobility data: part two
In part one, we looked at the initial impact of the COVID-19 outbreak and the short-term impact on fuel and...
Uncategorized
Understand ever-changing market conditions with mobility data: part three
Part three of our mobility blog series is available as a video, initially presented as part of Kalibrate's Fuel and...

