California fuel market study: platform application demos
Kalibrate recently conducted an extensive survey of gas stations to provide insight into demand, trade areas, competitive intensity, and traffic counts across the state. In these videos, we explore features of the data and how decision-makers can interrogate the data using our fuel planning software, Kalibrate Planning.

Site attributes captured
Let’s start by looking at what site attributes are included in the data — from traffic counts, fuel, diesel, and c-store brands, EV charging, parking spaces, fueling positions, and much more.
Watch the video:
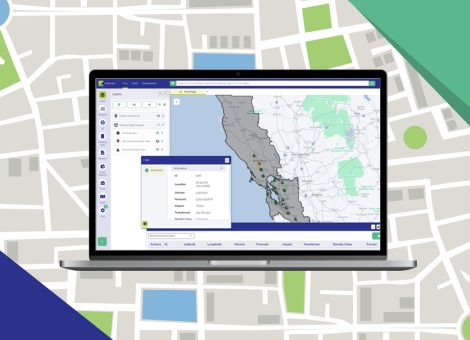
Market overview
We can take a macro view by looking at how brands are performing in California by examining site and market share. We can do this by the whole state, by county, and even more granularly. Note, some volume estimates are hidden in this preview.
Watch the video:
The 7 Elements of Retail Fuel Success
Kalibrate’s 7 Elements cover market, brand, facility, merchandising, price, and operations. Here, we examine the factors that influence each element, and how they contribute to volumes.
Watch the video:
Watch the video:
Performance potential quadrants (PPQ)
Interrogate how dirt strength (location) intersects with volume to identify overperforming and underperforming sites in your portfolio or the competition.
Watch the video:
Watch the video:
Read more articles about:
Location intelligenceRelated posts
Location intelligence
Market Optimizer: Demo video
Market Optimizer allows users to strategically grow their network in existing markets while balancing revenue...
Fuel pricing
The Kalibrate news round-up: June 2025
In this monthly feature, we look across the industry and mainstream news to uncover stories of note that we think are...


Start your journey to more informed decisions today
Get in touch to see how Kalibrate could empower your decision-making.