Q1 2022 - KLI platform update: Trip2Trade and parcel data integration
We are very excited to reveal the Q1 2022 release of the Kalibrate Location Intelligence (KLI) platform. This release includes some exciting new features and datasets along with some quality-of-life improvements to some existing features.
In KLI web browser:
Trip2Trade
Trip2Trade, which was previously only available within eSite TrailBlazer, is now available within KLI.
Trip2Trade is an alternative approach to trade area delineation which is more accurate than other methods such as drive time polygons. Drive time polygons illustrate how far a car can go, in minutes, in all directions from a site. But we know that just because a car can get a certain distance in x minutes, doesn’t mean that those cars actually travel that way. For example, interstates and major highways often form natural barriers and section out markets on either side. Though a car can get from one side of the interstate to the other in 10 minutes, likely most cars/market activity stays to the single side of the interstate. A drive time-based approach to trade area delineation doesn’t take into account the true behavior of the trip activity.
Trip2Trade allows you to delineate trade areas using mobility and connected car-derived data from actual known origins and destinations. The data is not simply pings from mobile phones, but highly cleansed trips where the start (origin) of the trip is known as well as the end of the trip (destination). That allows for the querying of any location (open location or potential site) to see where the trips come from that stopped at this location, or where the trips go to that started at this location. This allows the true market behavior of the people frequenting the location to determine the trade area.
For example, the below image illustrates a 60% Trip2Trade trade area as compared to a drive time polygon.
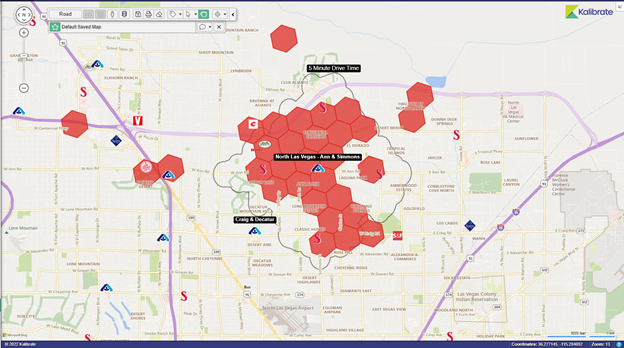
As the image above illustrates, the 5-minute drive time polygon around the subject Albertson’s extends past a lot of the competition that is in the area. The 60% Trip2Trade trade area, which is comprised of the red shaded hexagons, does not extend as far to the east and also does not extend as far to the southwest as there is another Albertsons located in that direction.
When we view the Trip2Trade trade area for the Albertson’s located at the intersection of Craig & Decatur, we see that it has very little overlap with the original site even though it is located very close to it.
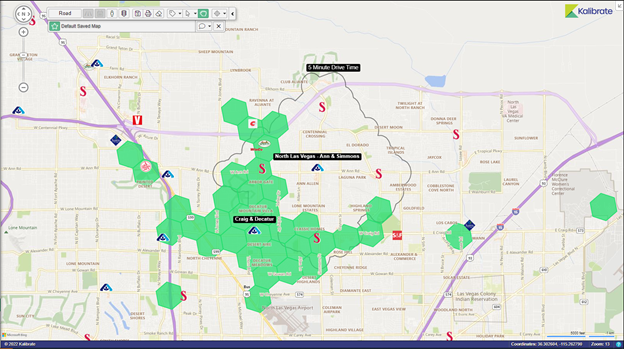
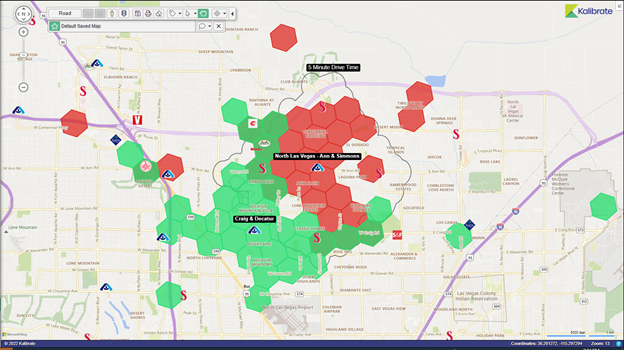
The Trip2Trade trade areas can be viewed for both stores at the same time and the areas of overlap can be visualized. In the image below, the overlap areas are shaded a darker green. In addition to mapping, there is a report within KLI that will show you the percent overlap between Trip2Trade based trade areas.
The toolset within KLI allows you to pull Trip2Trade data for specific days of the week and times of day so you can view how this impacts the trade areas. For example, does the trade area for a restaurant change between breakfast, lunch, and dinner? In addition, you can view trips derived from commercial vehicles separately from trips derived from consumer vehicles. This can be extremely beneficial for cases such as understanding the trade area of a commercial diesel set of pumps versus the consumer gasoline set of pumps.
The Trip2Trade module is the first time we are utilizing the H3 hexagon system within KLI. We will be adding the ability to visualize H3 hexagons for additional datasets in upcoming releases. You can read more about the H3 hexagon system in the following links:
Trip2Trade is licensed as an optional module in KLI and is priced per user. Please contact your account manager for a detailed demonstration and for pricing information.
Land parcel and property data
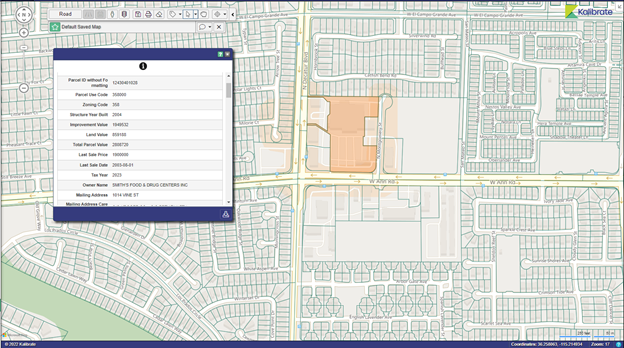
Per customer request, we have partnered with Regrid to include their parcel and property data within KLI. Our customers can now visualize property boundaries and obtain information about each parcel including land use, ownership, year structure built, last sale price, and land value. Below is a sample map along with an infobox showing details for a particular parcel.
The dataset contains 152+ million parcel boundaries and covers 99% of the US population. The Regrid parcel data is licensed as an optional module in KLI and is priced per user. Please contact your account manager for a detailed demonstration and for pricing information.
Photo enhancements
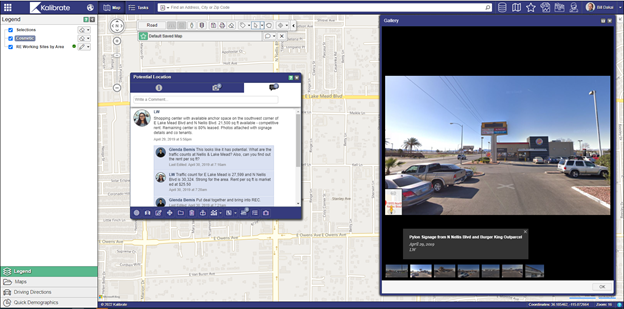
Several quality of life improvements related to photos have been added to KLI. Photos can now be viewed and edited within edit forms. This allows for a much more streamlined approach when reviewing others’ work.
In addition, the photo gallery viewer can now be resized and shown as a window within the application. This allows you to view the photo gallery at the same time as edit and info forms. The below image illustrates the photo gallery docked at the right of the screen so you can view the information/comments about the site.
Sales forecast integration
Several speed improvements have been added to the integration of Intalytics sales forecasting models within KLI. Options have been added to allow you to turn on/off the recalculation of trade area totals when adding/removing geographies from the model generated trade area. This makes it much faster if you are making significant changes to the default modeled trade area.
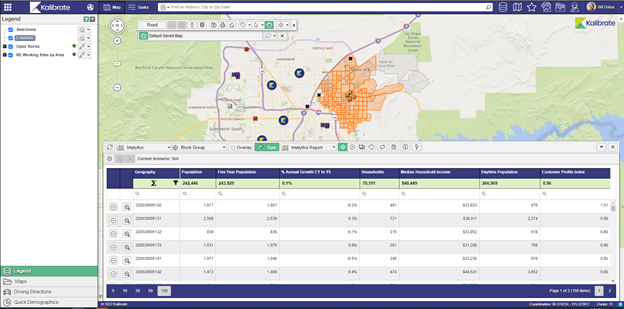
Additional speed improvements have been added when opening and saving model scenarios. A model scenario allows you to make changes to items such as the competitor or demographic landscape around the site. For example, you can close a store to see how that will impact your subject site’s sales. In addition, you can add hypothetical new competitors into the model via the scenario tool.
In KLI Mobile:
The next release of KLI Mobile will be available from the Google and Apple stores within the coming days. The highlights of this release include one touch creation of Intalytics sales forecast models and a new feature called Site Tours, which allows KLI Mobile to optionally track your location so you can recall areas that you visited while traveling a market.
Site tours
After a long day of visiting sites everything starts to blur together and it becomes hard to recall exactly where you went. KLI Mobile already contains an extensive set of tools for capturing data, photos, and comments when you’re in the field but it was lacking a tool for tracking the exact route you took when traveling between sites. The new site tour feature fills in this void and allows you to track your location when you are traveling a market so you can recall where exactly you visited.
Site tours creates a polyline that updates as you move and there are tools for creating, opening, appending, closing, and sharing site tours. When Kalibrate performs market studies for fuel retailers we send surveyors into the field to collect information such as parking, estimated convenience sales, and estimate gallons of fuel sold for all fuel locations in the market. In addition, we also ask the surveyor to add any new locations that have recently opened. Using the site tour feature, the surveyor can track all the roads they traveled and share the track with the survey manager to ensure they covered the whole market. This allows us to feel very confident that we did not miss any potential new locations.
Best of all, site tours work in both online and offline mode so no matter where you are this feature will be available.
Intalytics model integration
This release includes the integration of Intalytics models into KLI Mobile. Are you in the field visiting sites with a broker and would like to run a sales forecast to understand the potential of the site? This use case is now fully supported within KLI Mobile! The models that are created can be opened in the web version of KLI so you can continue working on your forecast when you return to the office.
KLI API
The Kalibrate Location Intelligence (KLI) API provides near real ¬time access to KLI related data. It is a platform for building applications and is available to organizations using KLI. The API uses the RESTful protocol and responses are available in JSON and XML formats.
The Q1 2022 release of the KLI API introduces the ability to generate disaggregate sales forecast models. If you have Intalytics based sales forecast models integrated into KLI, you can now integrate them into external applications via the API.
More information about the KLI API can be found at the interactive Swagger page located here. Please contact your account manager for more information.
Explore Kalibrate Location Intelligence.
Read more articles about:
Location intelligenceSubscribe and get the latest updates
You may unsubscribe from our mailing list at any time. To understand how and why we process your data, please see our Privacy & Cookies Policy
Related resources
Location intelligence
The Kalibrate news round-up: November 2025
In this monthly feature, we look across the industry and mainstream news to uncover stories of note that we think are...

Location intelligence
A guide to data centralization in retail real estate
Data centralization gives retail real estate teams a single, reliable source of truth, improving site decisions,...


