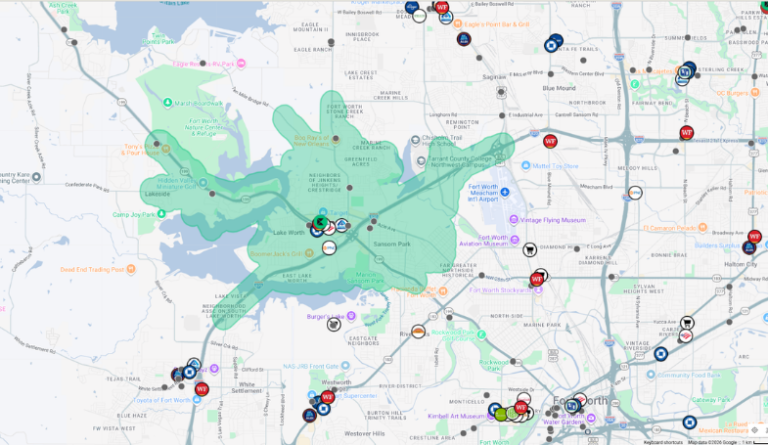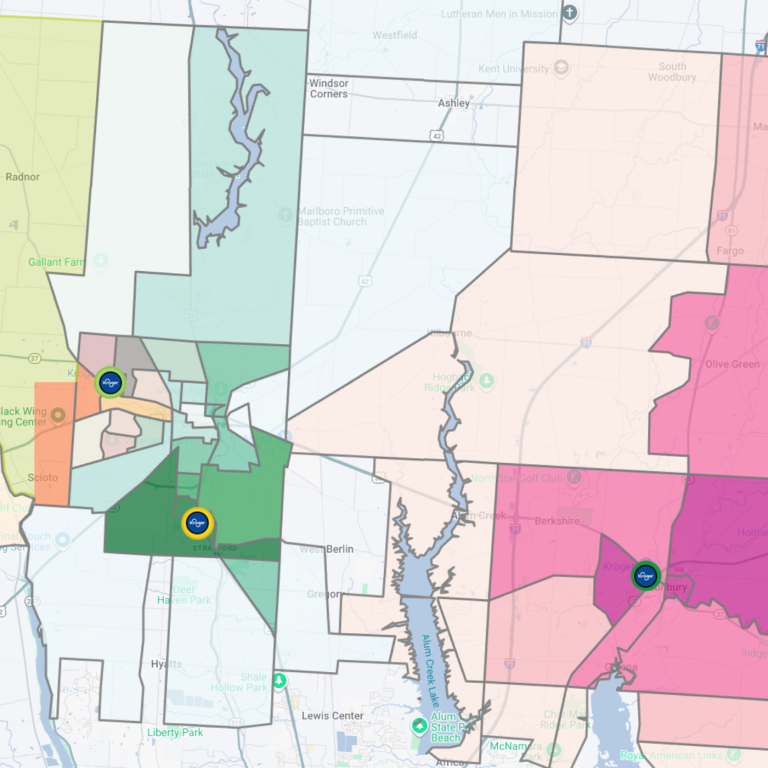
Knowing how much consumers are likely to spend in a market can be just as important as knowing how many consumers live there. Two trade areas may have the same population, but vastly different spending potential. For retailers, restaurants, and service providers, understanding those differences can reveal where market opportunities exist, where performance is lagging, and where future growth is most likely.
Spending patterns, often referred to as annual expenditure potential, provide an estimate of how much consumers spend across hundreds of product and service categories. When combined with location intelligence, competitive data, and customer analytics, expenditure potential helps organizations make more informed decisions about store performance, market opportunities, and expansion strategies.
There are two primary ways retailers use this data:
Measuring your share of the market
Retailers can use expenditure potential data to calculate market share, or the proportion of total consumer spending within a market that they current have capture. This provides valuable context when comparing performance across markets, highlighting where a retailer is the dominant player versus markets where it captures a smaller share of consumer spending.
By evaluating market share alongside store count and competitive intensity, retailers can identify underperforming stores or markets and investigate the underlying causes. These may include pricing, merchandising, marketing effectiveness, operational execution, or local competitive pressures. The result is a clearer understanding of where improvement efforts can deliver the greatest return.
Expenditure potential data also allows retailers to track market share changes over time. A retailer may be growing sales while still losing share to competitors that are growing even faster. This distinction is especially important during periods of market disruption, when sales growth alone may not provide an accurate picture of competitive performance.
Evaluating new opportunities
Expenditure potential is equally valuable when evaluating new market opportunities. Understanding the total spending available within a trade area helps retailers determine whether sufficient demand exists to support a new location.
This is particularly important in smaller markets. If a retailer has successful stores in markets with 50,000 households, can that success be replicated in markets with 25,000 or 30,000 households? By analyzing expenditure potential, market share, and competitive conditions in existing markets, retailers can establish benchmarks that help evaluate opportunities in new geographies with greater confidence.
A proven approach to grocery site selection
The supermarket industry has long relied on expenditure potential as a key input for site selection and sales forecasting. There are several reasons why this approach works particularly well:
- A single category, food consumed at home, accounts for a significant portion of supermarket sales.
- Food-at-home expenditures can be measured relatively consistently and isolated more easily than many other retail categories.
- Consumer demand for grocery products tends to be more stable than in discretionary retail sectors.
As a result, many supermarket forecasting models, particularly gravity-based forecasting models, use food-at-home expenditure potential as a foundational input.
Available data sources
Several providers offer expenditure potential datasets. One example is Synergos Technologies (STI), which provides spending pattern data for more than 600 categories at geographic levels ranging from national markets down to census block groups.
Synergos estimates annual per-capita expenditures across hundreds of products and services, including categories such as furniture, health insurance, and entertainment. This granularity allows analysts to measure consumer spending potential at the geographic level most relevant to their business.
Another widely used source is AGS Consumer Expenditure (CEX) data, which provides similar spending estimates across a range of product and service categories.
Much of this modeling is based on data from the Consumer Expenditure Survey (CES) conducted by the US Bureau of Labor Statistics. The survey combines thousands of household interviews and expenditure diaries to provide insight into how consumers allocate their spending across categories.
Understanding the people behind the purchase
While expenditure potential helps answer how much consumers are likely to spend, it does not explain who those consumers are or why they make certain purchasing decisions. That’s where behavioral datasets become valuable.
Behavioral data sources, such as the MRI Consumer Behavior Profiles available through AGS, provide insight into consumer lifestyles, preferences, and habits. Rather than measuring dollars spent, these datasets identify the share of the population that exhibits specific behaviors, owns particular products, or has certain interests.
Used together, expenditure potential and behavioral data provide a more complete view of market opportunity. One quantifies the size of the prize, while the other helps identify the consumers most likely to contribute to it. Combined with location intelligence and competitive analysis, these datasets enable retailers to make smarter decisions about where to invest, how to grow market share, and which markets offer the greatest potential for success.