Kalibrate has been surveying the Malaysia market since 2014. Our analysis helps fuel and convenience retailers in the market better understand their competitive environment to grow volumes through strategic investment.
Kalibrate differs from others in the space by building ground-truthed datasets that provide the most robust insights. We do this through national market surveys – we physically visit every fuel and convenience location in the target geography to build a highly detailed view of the active fuel networks.
We have just finished our latest survey – starting in Northern Malaysia, over a period of six weeks, the Kalibrate team visited 4319 stations covering Peninsular Malaysia and Sabah Sarawak. We drive every non-residential road, visit every petrol station, and collect 120 datapoints related to their location, market, brand, facilities, merchandising and operations.
Using this analysis, we build detailed market insights and predictive models that allow retailers to ask ”what if?” with robust and accurate sales forecasts for fuel, convenience and QSR.
Market saturation
When we look at fuel retail markets like Malaysia, understanding overall market saturation is incredibly challenging.
The market is constantly moving — population density shifts, new residential developments emerge, and new road infrastructure changes traffic flows. It’s almost impossible to say definitively when a market itself becomes saturated.
What you can start to see much more clearly, however, is when an individual brand becomes saturated.
As a brand opens more and more sites, the incremental volume delivered by each additional site typically declines. Using a simple saturation curve, you can see diminishing returns set in — not because the market stops growing, but because the brand’s own network density reaches a tipping point.
Outlet Share and Market Share combinations of competing brands within a given market will establish non-linear relationships. An “S” curve is valuable for analyzing these relationships.
Saturation Points in a given market.
- Critical Mass is the level of Outlet Share at which brand presence, acceptance and recognition begin to work in a brand’s favor
- Brands reach their Saturation Point when sites begin to take significant volume from other sites of the same brand
The ‘Sweet Spot’ is the range between these 2 points, where the highest incremental gain in Market Share resulting from Outlet Share changes can be observed.
Shell, Petronas and Petron are all well beyond the saturation point, though all are at or near the average market effectiveness line; at risk of cannibalization if sites are added to these brands.
Five have not yet got to critical mass – and as a result are not performing as well. Caltex and BHP are in the sweet spot, and slightly overperforming.
Network level growth
With those saturation levels in mind, lets look at recent growth at a network level – focusing on the last four years now – to ensure the data is a little more representative of the here and now.
The top two players have seen modest growth with Shell and Petronas only growing by 5% and 2% respectively.
Petron has grown aggressively, as has BHP. Caltex less so.
QSR penetration
QSR tells very different story. Everyone has grown – but to a different extent. Shell had the most to start out and hasn’t invested heavily here. Petronas 6%, Petron 4%, BHP 3%, Caltex 10%!
This highlights the global trend of maximizing the potential of the backcourt, and futureproofing locations. Let’s explore that further.
How are market leaders maximizing the potential of their c-stores?
It almost goes without saying that growth across existing retail locations is primarily coming from non-fuel retail. Fuel volumes are slowly declining, and we expect that trend to continue within Malaysia.
Having a c-store is no longer a differentiator – almost everyone has one – but what you do with the backcourt space is can make a real impact. Let’s explore how market leaders are maximizing the potential of their c-stores.
BHP, Caltex, Petron, and Shell are almost identical in terms of the size of the c-stores they have across their estate.
Petronas operates a much higher share of large-format c-stores – around three times the share of stores in the ≥121 sqm bands versus other, while Shell is concentrated in 40–80 sqm. This is a deliberate format strategy difference, not just noise.
But how does the size and associated product selection convert to sales?
Almost all retailers roughly double sales as they go from <40 sqm to 40-80sqm. We then see incremental gains as we step up through the larger categories, but as we can clearly see, some brands do better than others.
BHP lags behind its competitors in its ability to convert store size to sales. Petron has the strongest conversion with larger store footprints. Shell does well in stocking sites up to 160sqm then struggles with larger store footprints.
This analysis highlights the need for effectively scaling merchandising and product selection to meet store size.
Food as a differentiator
Let’s look at the impact of food offer – this is on c-store sales and does not include any separate QSR sales. In this chart, a sales index of 100 is the base and assumes no food or QSR offer.
Very little can be done with a small footprint, but a small store concept can achieve a marginal uplift in sales through having a small food offer. 40-80 and 80-120m2 shows a 1.5-2x uplift in c-store sales as a result
Interestingly, 40-80 m2 generally performs better – this shows size doesn’t always matter
Larger footprint stores, 120-160m allow you to add multiple concepts and become a destination which drives additional people to the store and drives sales.
One of the changes we’ve made to our survey form over the years is to expand from one QSR survey to four – that allows us to properly assess these multi-concept destinations.
Best practices in achieving potential
The 7 Elements provide a structured way to diagnose performance and prioritize action across all three sites, recognizing that no single factor drives success and that weak elements hold sites back.
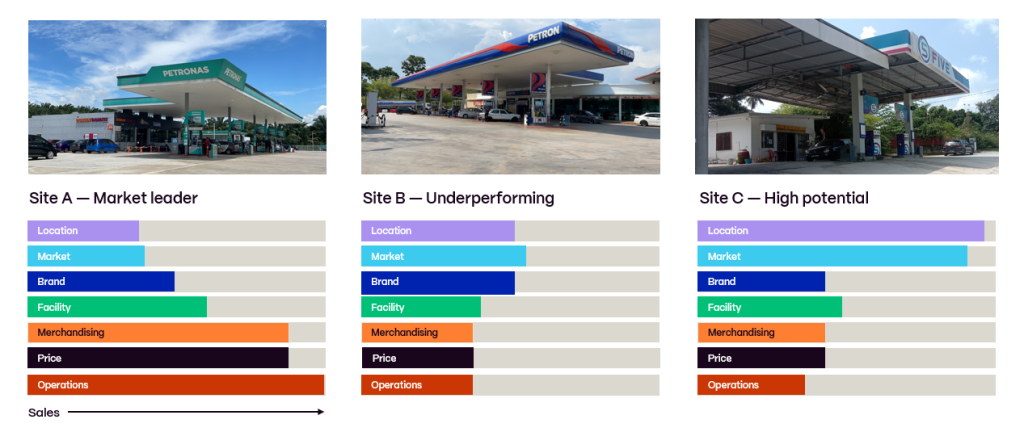
- For Site A (market leader), strength across most elements should be protected. Focus on maintaining brand, facility, and operations standards, while using price and merchandising tactically to defend share and sustain customer loyalty.
- For Site B (underperforming), the framework highlights gaps. Stronger facilities, improved merchandising, and better operations could unlock performance, while reviewing pricing ensures the offer is competitive.
- For Site C (high potential), the priority is investment. Location and market strength provide the “volume magnets,” but improvements in brand, merchandising, and operations are needed to convert demand into sales. High-potential sites often underperform due to fixable elements beyond location.
Across all sites, integrating all seven elements enables data-driven decisions that improve volume, customer experience, and long-term profitability.
Malaysia market summary
- The market continues to grow, but major brands are reaching the saturation point
- Petronas and Shell continue to dominate, but other majors are quickly catching up, and new players are aggressively growing
- C-Store is an expectation; food service has become the differentiator
- The ability to convert a footprint to sales varies significantly by brand
- The key to optimization is maximizing the potential of your footprint
- Precision of site potential and offer is key