Kalibrate analyzed ChainXY’s 2025 Changes Over Time dataset to see where restaurant growth is actually landing at the DMA level. We looked at the overall picture across all restaurant types that operate 21-100 locations, then zoomed in on five categories driving much of that change: QSR/Fast Food, Fast Casual, Juice Bars, Coffee and Tea, and Bakery and Desserts.
Growth is not evenly distributed, and it isn’t following a single regional storyline. Sunbelt momentum is real, but legacy metros like Chicago and New York continue to show up – sometimes leading the pack, sometimes churning heavily without much net gain.
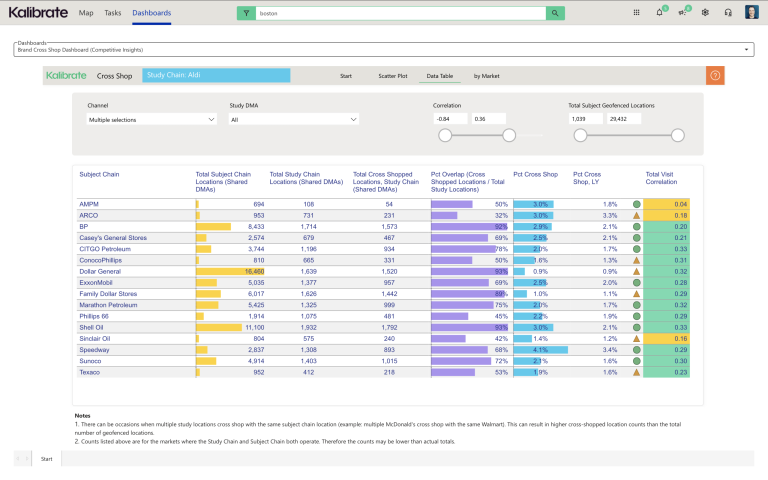
The top DMAs for restaurant growth overall
Across the emerging restaurant chains with 21-100 locations tracked by ChainXY, Chicago led the country with a net gain of 41 locations, followed closely by New York at +39. From there, the top ten is a mix of legacy metros and fast-growing Sunbelt markets: San Francisco-Oakland-San Jose (+27), Austin (+25), Atlanta (+24), and a tight cluster of Sacramento, San Antonio, and Tampa-St. Pete all at +21.
What’s notable is how the leaderboard is built. New York posted 179 openings – by far the most of any DMA – but also 140 closures, meaning its net result reflects intense churn rather than clean expansion. Chicago, by contrast, paired strong opening volume (116) with comparatively lower closure activity to take the top spot. The category breakdowns below show where that growth is concentrated.
QSR and Fast Food
Fast Casual
Juice Bars
Coffee and Tea
Bakery and Desserts
What it means
Sunbelt metros – Dallas-Ft. Worth, Houston, Phoenix, Austin, San Antonio, and the major Florida DMAs – show up almost everywhere. These are the markets where formats are scaling fastest.
Chicago is quietly the most active restaurant market in the country. It leads the overall leaderboard, QSR, and Bakery and Desserts, and posts solid Juice Bar growth – a reminder that legacy metros still have meaningful absorption capacity when the format fits.
High opening volume isn’t the same as net growth. New York and Los Angeles dominate raw opening counts in several categories but lose much of that activity to closures. For brands and investors evaluating where to deploy capital, net change at the DMA level remains one of the clearest signals available.
Want access to this data?
ChainXY datasets are available in the Kalibrate Location Intelligence platform, giving teams the ability to track openings, closures, and co-tenancy patterns market by market – and turn data like this into a competitive read on where to grow next.
Speak with our team to see how this data can work for you.