
Uncover market trends that drive smarter decisions
Exclusively for Canadian fuel retailers: Access detailed market, volume, and competitor data. Turn powerful insights into confident, data-driven strategies to maximize performance.
Get in touch today to book a demo at a time that suits you.
Why choose Kalibrate Market Intelligence?
Understand your market landscape
Gain a complete picture of market dynamics, competitor performance, and brand positioning. Make informed, data-driven decisions with confidence and clarity.
Identify growth opportunities
Spot underperforming sites, emerging competitors, or market share shifts early, and act decisively to capture untapped potential.
Measure strategy effectiveness
Track how pricing, branding, and investment strategies impact performance over time with granular, location-level market intelligence.
Build competitive advantage
Stay ahead of market changes with reliable, current data and deep insights built on over 40 years of Kalibrate expertise.
Kalibrate Market Intelligence
Kalibrate Market Intelligence
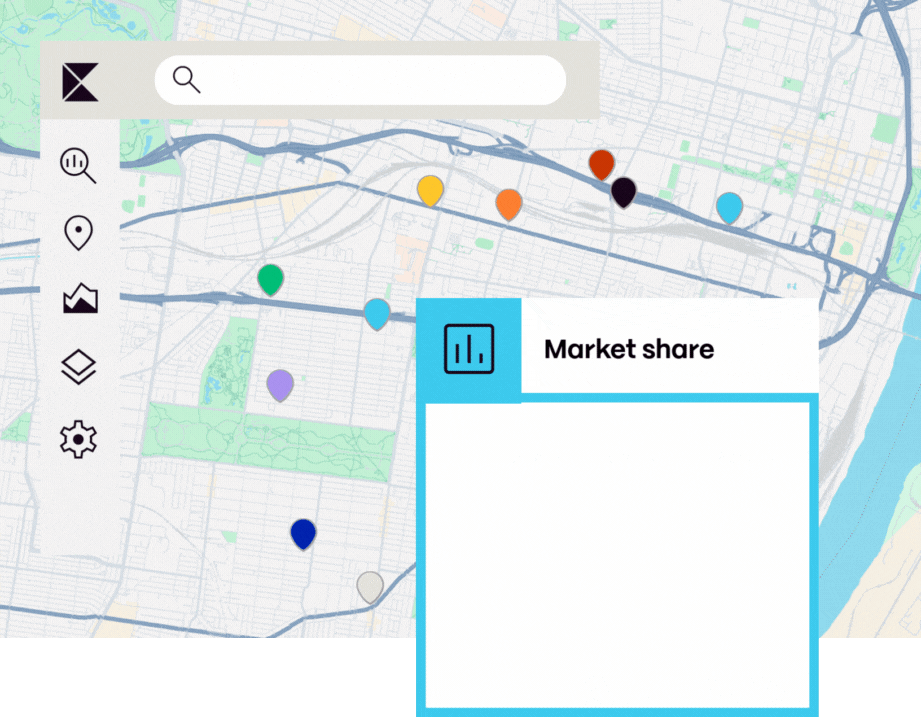
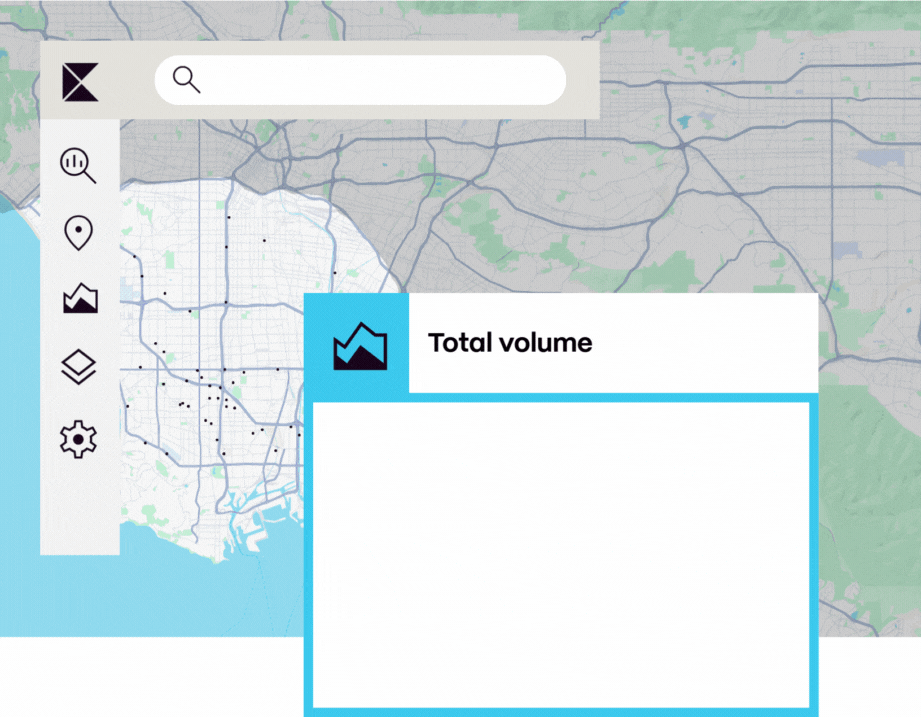
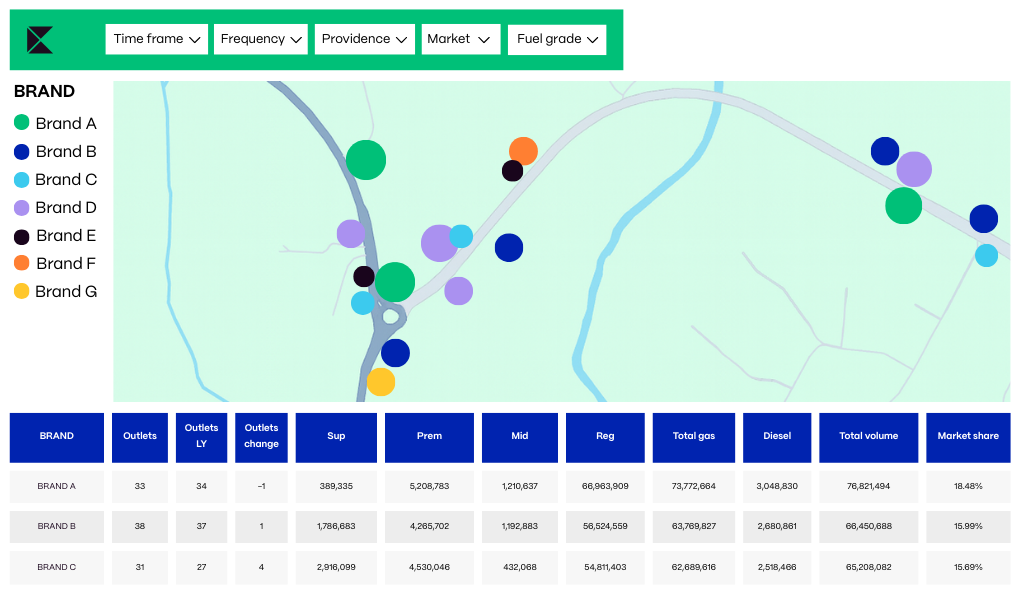
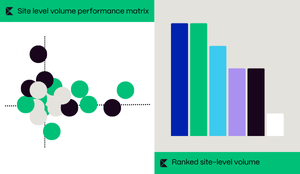
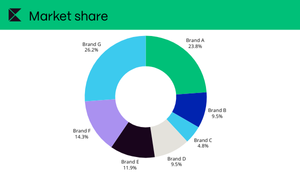
Visualize brand, marketer, and site performance
Analyze volumes, market share, and site-level metrics to see exactly how your brand and competitors are performing across regions.
Track market changes over time
Access historical and current data to monitor performance trends, evaluate strategy impact, and anticipate shifts in competitive dynamics.
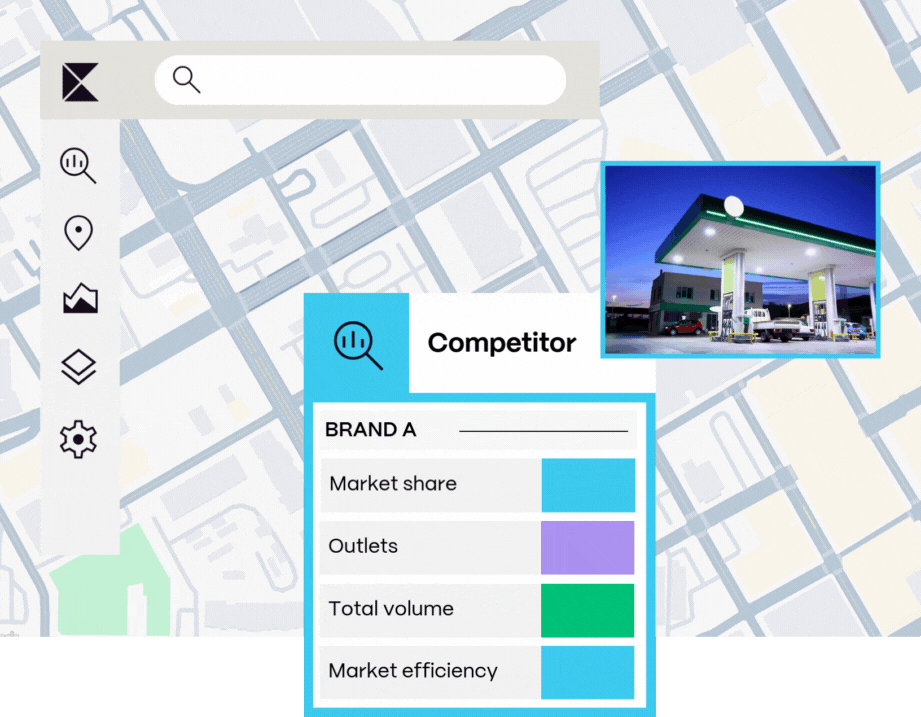
Benchmark against your key competitors
Compare performance across multiple KPIs to identify tactical opportunities and measure how decisions influence market position.
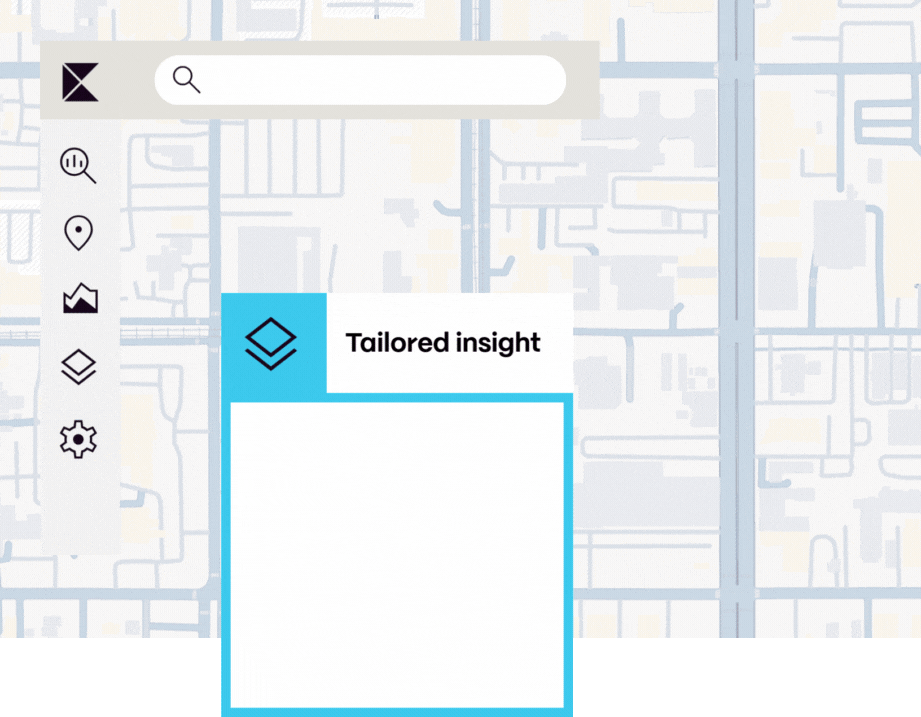
Tailored insights for your business needs
Leverage Kalibrate’s Power BI integration or flat data files to build custom dashboards that match your unique reporting requirements.
Visualize brand, marketer, and site performance
Analyze volumes, market share, and site-level metrics to see exactly how your brand and competitors are performing across regions.
Track market changes over time
Access historical and current data to monitor performance trends, evaluate strategy impact, and anticipate shifts in competitive dynamics.
Benchmark against your key competitors
Compare performance across multiple KPIs to identify tactical opportunities and measure how decisions influence market position.
Tailored insights for your business needs
Leverage Kalibrate’s Power BI integration or flat data files to build custom dashboards that match your unique reporting requirements.
Trusted by Canadian fuel retailers

“Kalibrate is always available to support us, highly responsive, and consistently professional. They are courteous, eager to provide training whenever requested, and demonstrate a strong business acumen.”
Valentin Vignon, Harnois Energies

“For Kalibrate Market Intelligence, I’d give a 10/10. Whenever I have a question, I get an answer, almost instantly. It helps us make our decisions.”
Patrick Kamel, Sobey’s
7154
Sites covered in our survey data
> 80 %
Canadian fuel volume captured
89
Fuel retailers included
> 100
data points collected for every site
436
Canadian markets covered
Where does KMI data come from, and how do you collect it?
KMI data is collected through in‑person site surveys conducted by field surveyors across Canada.
Surveyors collect pump metre readings to compute fuel volumes, record spot prices at the time of visit, and capture changes to 100+ station attributes. Including:
- forecourt configuration
- convenience store brand
- size
- offerings
- car wash availability and type
- food offerings
- EV charging
- Promotions
How often is KMI data updated?
All markets are surveyed on at least a quarterly basis, with higher‑frequency monthly tracking in major metropolitan areas: Vancouver, Edmonton, Calgary, Winnipeg, Toronto, Ottawa, Montreal, Quebec City, Halifax.
What markets or regions does KMI cover?
Nationwide coverage across Canada: 7,000+ retail fuel outlets in 400+ markets .
Use the Site Select tool to see the full coverage.
How is KMI different from other market data tools?
KMI provides site level data, including actual volumes sold for over 85% of stations surveyed.
KMI data is trusted for its accuracy, objectivity, completeness, and timeliness.
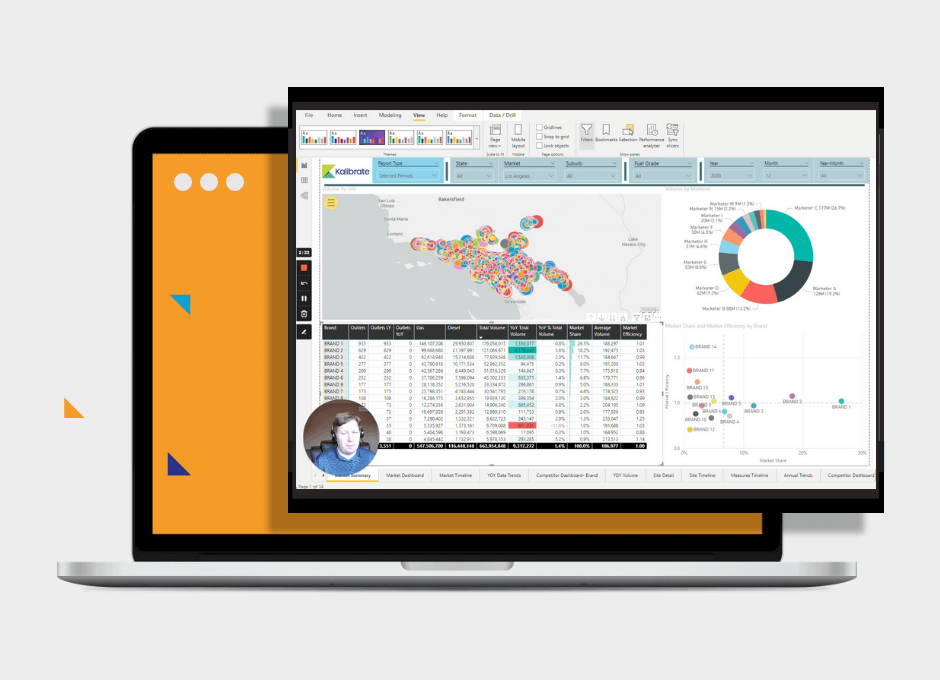
How can I access and use the KMI data?
KMI data can be delivered via Power BI dashboards, Excel Power Pivot files, CSV flat files, traditional market summary or detail reports, total industry reports or bespoke outputs. Data can be subscribed to by the market for ongoing report delivery, as needed on an ad-hoc purchase basis, or via prepaid site level packages.
Ready to learn more?
Discover more about Kalibrate Market Intelligence


Stay competitive in Canada’s fuel retail industry with proven market intelligence